
|
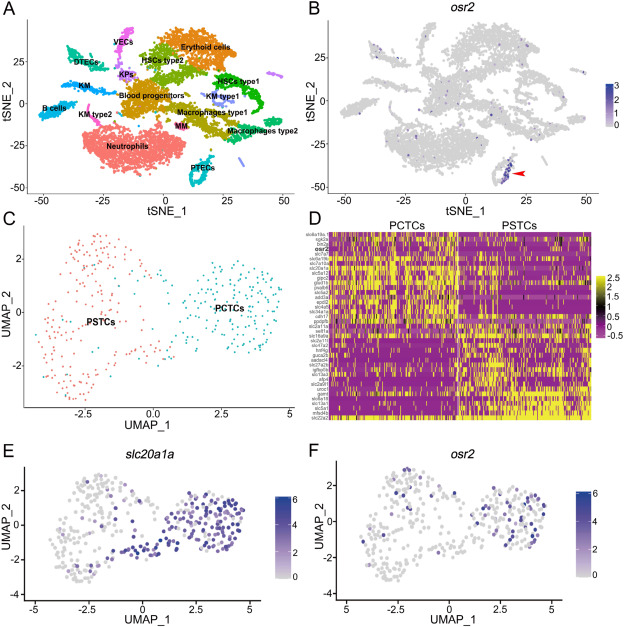
Fig. 1 Expression pattern of osr2 in zebrafish kidney. A-B: scRNA-seq analysis showed that osr2 was expressed in PTECs. tSNE plots show zebrafish kidney cell clusters and the expression of osr2. HSCs, hematopoietic stem cells; KPs, Kidney progenitors; KM, Kidney Multiciliated; MM, Macrophages Myeloid; KM, Kidney mucin; VECs, Vascular endothelium cells; DTECs, distal tubule epithelial cells; PTECs, proximal tubule epithelial cells. C: Cluster DTECs was divided into PSTCs and PCTCs subpopulations. D: Heatmap shows relative log-expression of some genes in PCT or PST in C. E-F: Expression analysis of slc20a1a and osr2 in each subpopulation. PCTCs, proximal convoluted tubule epithelial cells; PSTCs, proximal straight tubule epithelial cells.