
|
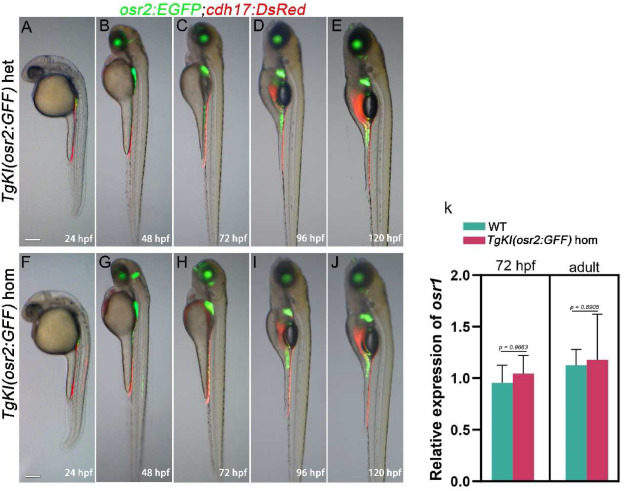
Fig. 5 Embryo morphology of TgKI(osr2:GFF) homozygotes and TgKI(osr2:GFF) heterozygotes. A-J: Use of Tg(osr2:EGFP;cdh17:DsRed) background to show TgKI(osr2:GFF) heterozygotes (A-E) and TgKI(osr2:GFF) homozygotes (F-J) embryo developmental morphology, development of PCT and renal tubules at the indicated stages are shown (n = 6). K: qRT‒PCR analyses of osr1 in embryonic and adult TgKI(osr2:GFF) homozygous and WT zebrafish kidneys (n = 3 biological replications per group). hom, homozygotes; het, heterozygotes. Scale bar in A to J, 500 μm. The data in K were analyzed by two-sided t-test and are presented as mean values ± SD