
Image
|
Figure Caption
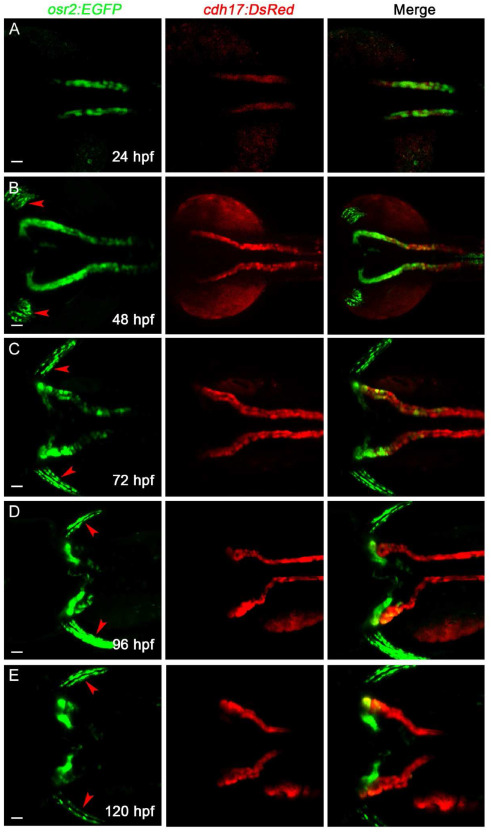
Fig. 4 The PCT morphogenesis is labeled by EGFP in Tg(osr2:EGFP) embryos. A-E: Dorsal view of the PCT cells that are co-labeled by EGFP and DsRed at the indicated stages are shown (n = 6). osr2:EGFP expression in the pectoral fins (red arrowhead) can be observed. Scale bar in A to E, 200 μm. (For interpretation of the references to color in this figure legend, the reader is referred to the Web version of this article.)
Acknowledgments
This image is the copyrighted work of the attributed author or publisher, and
ZFIN has permission only to display this image to its users.
Additional permissions should be obtained from the applicable author or publisher of the image.
Full text @ Heliyon