
- Title
-
Mutant analysis of Kcng4b reveals how the different functional states of the voltage-gated potassium channel regulate ear development
- Authors
- Jędrychowska, J., Vardanyan, V., Wieczor, M., Marciniak, A., Czub, J., Amini, R., Jain, R., Shen, H., Choi, H., Kuznicki, J., Korzh, V.
- Source
- Full text @ Dev. Biol.
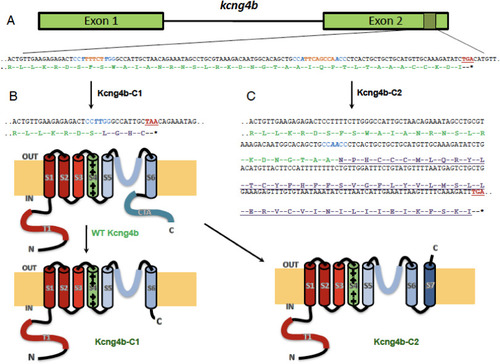
kcng4b-C1 and kcng4b-C2 mutations differently affect Kcng4b’s C-terminal. A - kcng4b nucleotide sequence is in black, stop-codons are in red, gRNAs' PAM-sequences are in blue, and deleted nucleotides are in orange. The Kcng4b amino-acid sequence is in green, the modified one in lilac. B - mutation kcng4b-C1 caused Kcng4b C-terminal truncation. C - mutation kcng4b-C2 caused an extension of Kcng4b polypeptide and formation of an additional C-terminal TM domain (S7, underlined). T1 and CTA – N- and C-terminal cytoplasmic domains, S1–S7 – TM domains. IN, OUT – intracellular and extracellular space. |
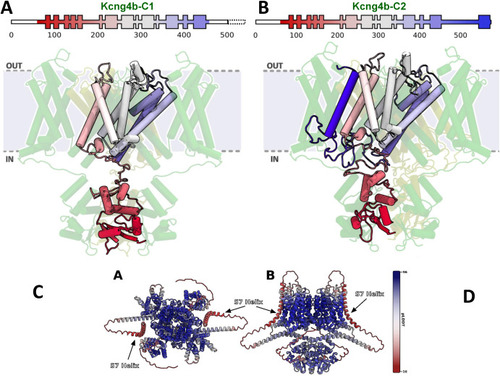
Modelling of Kcng4b/Kv6.4 mutant monomers. Kcng4b-C1 (A), Kcng4b-C2 (B–D). IN, OUT – internal and external space. The deleted C-terminal region of Kcng4b-C1 is indicated by the dashed box. The additional transmembrane domain of Kcng4b-C2 (S7) is in dark blue. (C) Top and (D) side view of structure of Kv1.2–2.1 + Kcng4b tetramer as predicted by AlphaFold Multimer v3, colored by per-residue model confidence score (pLDDT). Two monomers of each protein were used to form the tetramer, analogous to the simulated model. AlphaFold clearly predicts the S7 helix in the membrane, bound to the core of the tetramer. Confidence score of the S7 helix prediction is low, which is expected from the terminus of the protein and a sequence that was not under evolutionary pressure. |
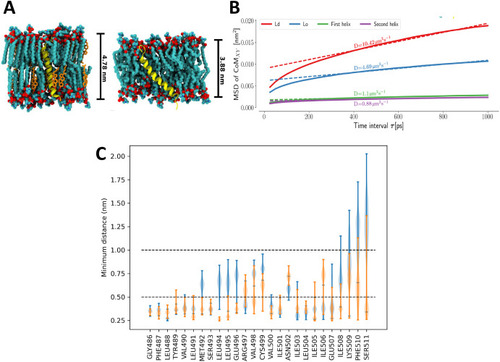
Characterization of S7 domain in the Kcng4b-C2 mutants. A - Representations of isolated helix systems of Kcng4b-C2; S7 in a thicker, more stiff liquid ordered (Lo) phase (left), S7 in a thinner, looser liquid disordered (Ld) phase (right). B - Plots of mean square displacement (MSD) against time interval τ. Helices described as first and second refer to the S7s from two different Kcng4b/Kv6.4 monomers in the tetramer. Here, MSD measures displacement of the center of mass of the helix in membrane plane within the time interval τ. The slope of the MSD at long times is related to the diffusion coefficient D, equivalent to one obtained by standard experimental methods, e.g., single-molecule tracking. C - Distributions of minimum distances between the residues of S7 helices and the remaining membrane-bound part of the channel. Distributions for each of the helices are shown separately in blue and orange. |
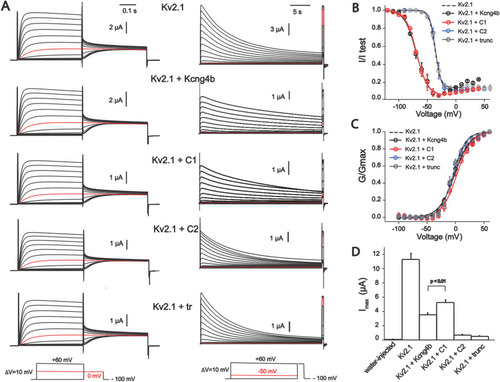
Biophysical properties of homomeric Kv2.1 (KCNB1) and heteromeric Kv2.1/Kv6.4. (Kcng4b) channels studied in X. laevis oocytes. A - Whole-oocyte current traces of Kv2.1 homomeric and Kv2.1/Kcng4b heteromeric channels elicited by step-depolarization of the oocyte membrane from −100 mV to +60 mV with 10 mV increments (left) for estimation of steady-state activation. Current traces for estimation of the steady-state inactivation of channels is shown to the right. Current was induced by step-depolarization of membrane from −100 mV with 10 mV increments followed by short test pulse to +60 mV for GV curves. The holding potential of oocytes expressing Kv2.1+kcng4b-wt and Kv2.1+kcng4b-C1 was −120 mV in inactivation protocol. The final depolarization step is +40 mV for these channels. Current traces shown in red color correspond to 0 mV for IV protocol and −50 mV for estimation of Steady-state inactivation. B - Steady-state inactivation curves of channels. Solid curves correspond to the fit of the Boltzmann function wit offset to the data points. C - Conduction-voltage (GV) relationship of channels shown in A. Solid curves correspond to the fit of the Boltzmann function to data. D - Current density of channels measured as peak current + 60 mV. Due to very low expression of Kv2.1 + C2 and Kv2.1+ Kcng4b-trunc channels, current traces shown in panel A and data points in B and C correspond to measurements 72–96 h post injection period whereas current amplitudes shown in D reflect 48 h after injection. Error bars in the graphs represent ±SEM. P > 0.01 – Student's unpaired T-test was used to compare the groups; n ≥ 7 for all experiments. Abbreviations: C1 - kcng4b-C1; C2 - kcng4b-C2; Kcng4b-trunc - N-terminal truncated Kcng4b (Shen et al., 2016). |
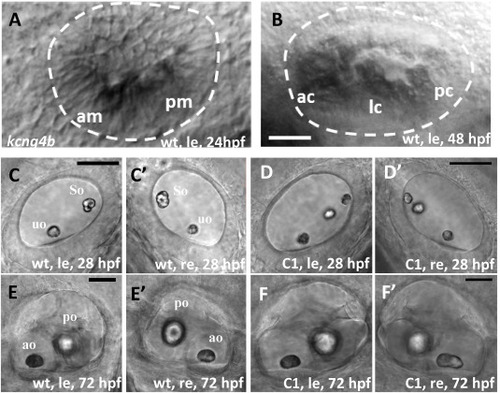
Kcng4b plays a role in ear development. All images are lateral views (anterior towards the left). A, B – whole mount in situ hybridization, kcng4b, left ear, A - 24 h; B - 48 hpf. C– F - DIC microscopy. C-E − ears at 28 hpf; and D, F - 72 hpf, le and re – left and right ears, uo and so – utricular and saccular otoliths, correspondingly; A, B, C, E − wildtype, D, F – kcng4b-C1 mutant. Abbreviations: C1 - kcng4b-C1; hpf - hours post fertilization; le - left-hand side ear; re - right-hand side ear; wt - wildtype. Scale bar = 50 μm. PHENOTYPE:
|
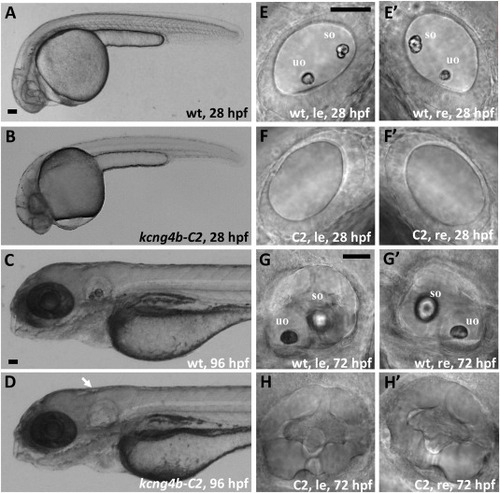
kcng4b-C2 mutation causes an absence of otoliths. A, B – 28 hpf, arrow - ear; C, D – 96 hpf; E-H – ears at 28 (E, F) and 72 hpf (G, H), le and re – left and right ears, uo and so – utricular and saccular otoliths, correspondingly. All images are in lateral view. A, C, E, G – wild type, B, D, F, H – kcng4b-C2. Abbreviations: C2 - kcng4b-C2; hpf - hours post fertilization; le - left-hand side ear; re - right-hand side ear; wt - wildtype. Scale bar = 50 μm. |
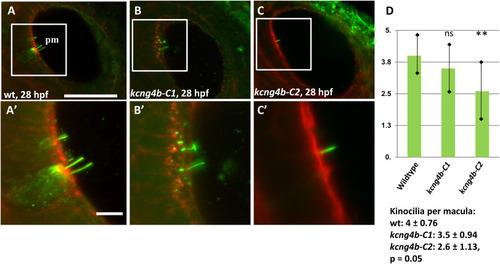
The development of inner ear sensory cells is affected in kcng4b-C1 and kcng4b-C2 mutants. Immunohistochemical staining using the anti-acetylated tubulin antibody (green)/phalloidin (red), 28 hpf, right-hand side ear. A – wild type, B - kcng4b-C1, C - kcng4b-C2, D – number of kinocilia per macula. PHENOTYPE:
|
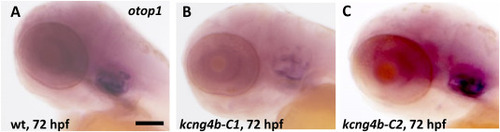
The expression of otop1 was affected in kcng4b-C1 and kcng4b-C2 mutants as detected by whole mount in situ hybridization at 72 hpf. A – wildtype, B - kcng4b-C1, C - kcng4b-C2, Scale bar, 100 μm. EXPRESSION / LABELING:
PHENOTYPE:
|

ZFIN is incorporating published figure images and captions as part of an ongoing project. Figures from some publications have not yet been curated, or are not available for display because of copyright restrictions. |
|
ZFIN is incorporating published figure images and captions as part of an ongoing project. Figures from some publications have not yet been curated, or are not available for display because of copyright restrictions. PHENOTYPE:
|
|
ZFIN is incorporating published figure images and captions as part of an ongoing project. Figures from some publications have not yet been curated, or are not available for display because of copyright restrictions. EXPRESSION / LABELING:
PHENOTYPE:
|
|
ZFIN is incorporating published figure images and captions as part of an ongoing project. Figures from some publications have not yet been curated, or are not available for display because of copyright restrictions. EXPRESSION / LABELING:
|
Reprinted from Developmental Biology, 513, Jędrychowska, J., Vardanyan, V., Wieczor, M., Marciniak, A., Czub, J., Amini, R., Jain, R., Shen, H., Choi, H., Kuznicki, J., Korzh, V., Mutant analysis of Kcng4b reveals how the different functional states of the voltage-gated potassium channel regulate ear development, 50-62, Copyright (2024) with permission from Elsevier. Full text @ Dev. Biol.