
- Title
-
The CDK Inhibitor Dinaciclib Improves Cisplatin Response in Nonseminomatous Testicular Cancer: A Preclinical Study
- Authors
- Rossini, E., Tamburello, M., Abate, A., Zini, S., Ribaudo, G., Gianoncelli, A., Calza, S., Valcamonico, F., Suardi, N.R., Mirabella, G., Berruti, A., Sigala, S.
- Source
- Full text @ Cells
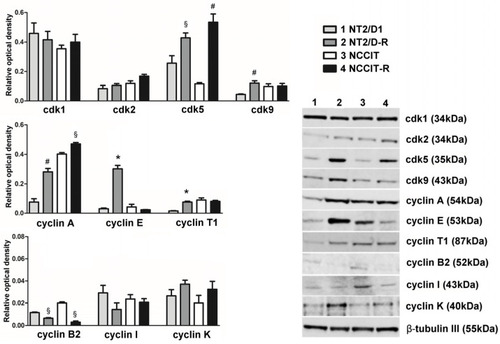
CDKs targeted by dinaciclib and their related cyclin protein expression in NT2/D1, NT2/D1-R, NCCIT and NCCIT-R cells. A total of 30 µg of total cell lysate was separated on a 4–12% Bis–Tris gel as described. Lane 1—NT2/D1, lane 2—NT2/D1-R, lane 3—NCCIT, lane 4—NCCIT-R. The human β-tubulin was used as an internal control. Quantification results are presented as a relative optical density means ± SEM of three independent experiments, and representative Western blot results are shown. * |
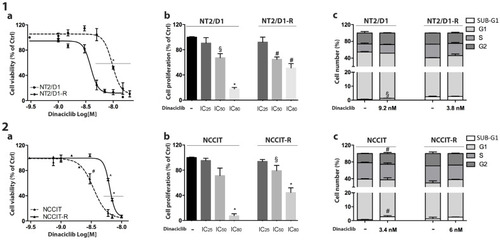
Effect of dinaciclib on NT2/D1/-R and NCCIT/-R cells. ( |
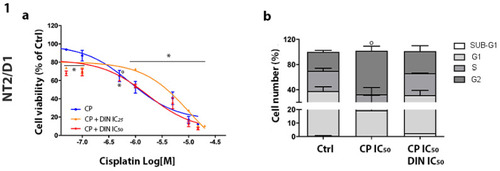
Effect of CP plus dinaciclib treatment on NT2/D1/-R cells. ( |
Effect of CP plus dinaciclib treatment on NT2/D1/-R cells. ( |
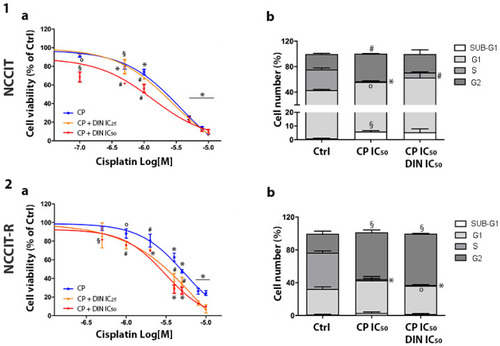
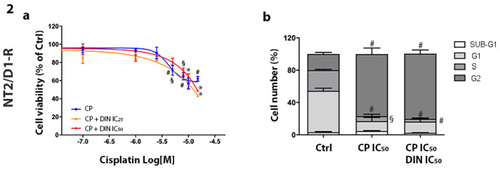
Effect of CP plus dinaciclib treatment on NCCIT/-R cells. ( |

Area of NT2/D1/-R and NCCIT/-R tumor xenograft in AB zebrafish embryos exposed to dinaciclib alone or combined with CP. ( |