IMAGE

Figure 2

ID
ZDB-IMAGE-240315-131
Source
Figures for Rossini et al., 2024
Image
Figure Caption

Figure 2

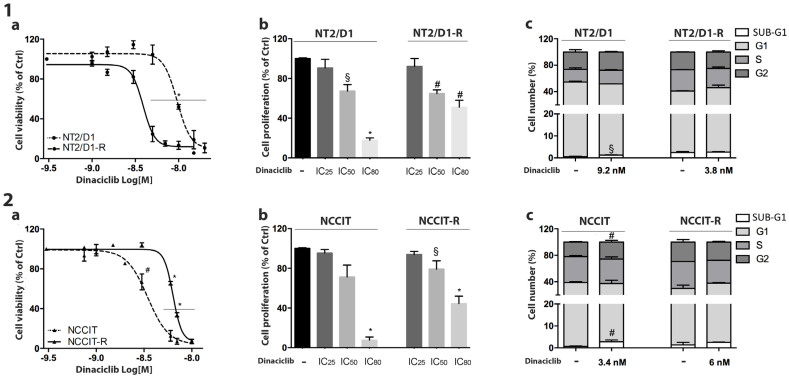
Effect of dinaciclib on NT2/D1/-R and NCCIT/-R cells. (a) Cell viability. NT2/D1/-R (1) and NCCIT/-R (2) cells were treated with increasing concentrations of dinaciclib for forty-eight hours as described in Methods. Cell viability was analyzed using the MTT assay. Results are expressed as the percentage of viable cells vs. untreated cells (ctrl). Data are the mean ± S.E.M. of three experiments performed in triplicate. * p < 0.0001 vs. untreated cells, # p < 0.001 vs. untreated cells. (b) Cell proliferation. NT2/D1/-R (1b) and NCCIT/-R (2b) were treated for forty-eight hours with the corresponding calculated IC25, IC50 and IC80 concentrations of dinaciclib. Cell proliferation was assessed using the cytometer count. Results are expressed as the percentage of viable cells vs. untreated cells (Ctrl) ± SEM. § p < 0.05 vs. untreated cells, # p < 0.001 vs. untreated cells, * p < 0.0001 vs. untreated cells. (c) NT2/D1/-R and NCCIT/-R cell-cycle distribution after drug treatment. NT2/D1/-R (1c) and NCCIT/-R (2c) were treated with the corresponding IC50 concentration of dinaciclib for forty-eight hours, and the cell-cycle distribution was analyzed. Histograms representing the percentage of cells in each cell-cycle phase are reported. § p < 0.05 vs. untreated cells, # p < 0.001 vs. untreated cells.

Acknowledgments
This image is the copyrighted work of the attributed author or publisher, and ZFIN has permission only to display this image to its users. Additional permissions should be obtained from the applicable author or publisher of the image. Full text @ Cells