IMAGE

Figure 5

ID
ZDB-IMAGE-240315-137
Source
Figures for Rossini et al., 2024
Image
Figure Caption

Figure 5

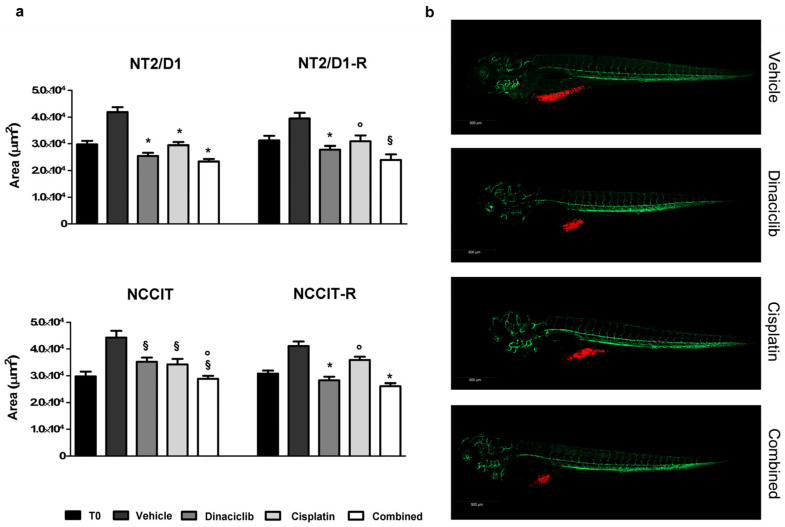
Area of NT2/D1/-R and NCCIT/-R tumor xenograft in AB zebrafish embryos exposed to dinaciclib alone or combined with CP. (a) Tumor areas at 120 hpf (T3—end of treatment) of drug-treated and vehicle-treated embryos were measured using Zen 2.3 Black software from ZEISS. Results are reported as area (µm2) ± SEM. * p < 0.0001, § p < 0.01, ° p < 0.05 vs. vehicle or single drug as indicated in Table 3. (b) Representative, lateral-view pictures of Tg (kdrl:EGFP) untreated and treated embryos at 120 hpf xenografted with NT2/D1 cells. Cells were labeled with a red fluorescent lipophilic dye, while the embryo endothelium was labeled with a green fluorescent protein reporter driven by the kdrl promoter. Images were acquired using a Zeiss LSM 900 confocal microscope at 10× magnification.

Acknowledgments
This image is the copyrighted work of the attributed author or publisher, and ZFIN has permission only to display this image to its users. Additional permissions should be obtained from the applicable author or publisher of the image. Full text @ Cells