
- Title
-
CIAO1 and MMS19 deficiency: a lethal neurodegenerative phenotype caused by cytosolic Fe-S cluster protein assembly disorders
- Authors
- van Karnebeek, C.D.M., Tarailo-Graovac, M., Leen, R., Meinsma, R., Correard, S., Jansen-Meijer, J., Prykhozhij, S.V., Pena, I.A., Ban, K., Schock, S., Saxena, V., Pras-Raves, M.L., Drögemöller, B.I., Grootemaat, A.E., van der Wel, N.N., Dobritzsch, D., Roseboom, W., Schomakers, B.V., Jaspers, Y.R.J., Zoetekouw, L., Roelofsen, J., Ferreira, C.R., van der Lee, R., Ross, C.J., Kochan, J., McIntyre, R.L., van Klinken, J.B., van Weeghel, M., Kramer, G., Weschke, B., Labrune, P., Willemsen, M.A., Riva, D., Garavaglia, B., Moeschler, J.B., Filiano, J.J., Ekker, M., Berman, J.N., Dyment, D., Vaz, F.M., Wassermann, W.W., Houtkooper, R.H., van Kuilenburg, A.B.P.
- Source
- Full text @ Genet. Med.
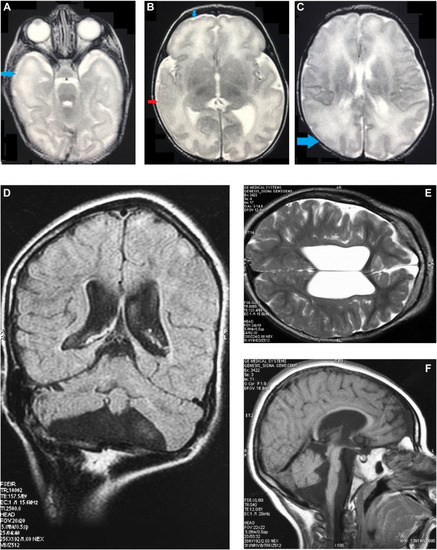
Magnetic Resonance Images (MRI) of patient 1 and 3. T2-weighted images at the age of 5 days of patient 1 showed regions in both hemispheres with a simplified gyral pattern, indicated by blue arrows in (A), (B), and (C). The red arrow in (B) marks a possible abnormal lateral right temporal lobe, but the actual anatomy is obscured by a Gibbs artifact. MRI of patient 3 at the age of 4 years ([D] (FLAIR), [E] (T2 weighted), and [F] (T1 weighted) showed enlarged lateral and third ventricles, decreased volume of cerebral white matter and incomplete myelination, and pontocerebellar atrophy. |
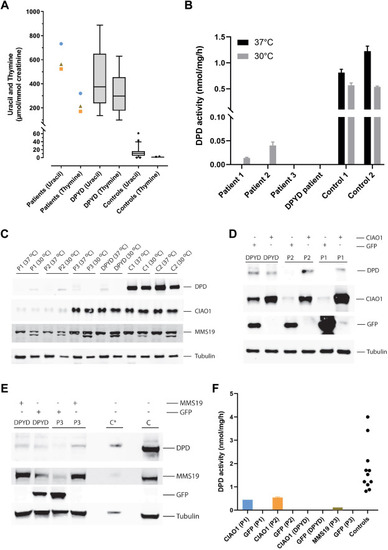
Biochemical characterization of CIAO1 and MMS19 deficiency. A. The urinary uracil and thymine concentrations from all 3 study patients (patient 1, blue circle; patient 2, orange square; and patient 3, brown triangle) and boxplots of the urinary uracil and thymine concentrations in DPYD-deficient patients and controls. B. The results of the DPD activity analysis in fibroblasts cultured at 37°C and 30°C. C. An immunoblot analysis of DPD, CIAO1, and MMS19 in fibroblasts from the 3 study patients, a DPYD-deficient patient and 2 controls, cultured at 37°C and 30°C. D. The immunoblot analysis of CIAO1 and DPD in fibroblasts of patients 1, 2, and a DPYD-deficient patient, stable-transfected with wild-type CIAO1. E. The immunoblot analysis of MMS19 and DPD in fibroblasts of patient 3 and a DPYD-deficient patient, stable-transfected with wild-type MMS19. Control fibroblasts C (10 μg protein) and C∗ (1 μg protein). F. The reappearance of the DPD activity in fibroblasts of the patients 1 and 2 stably transfected with wild-type CIAO1 and in fibroblasts of patient 3 stably transfected with wild-type MMS19. |
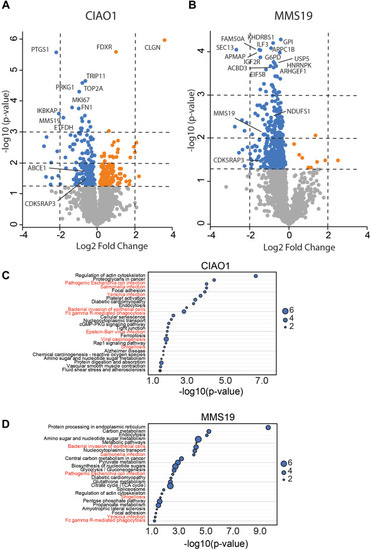
Volcano plot depicting proteomics data in CIAO1 and MMS19 deficient fibroblasts. (A) CIAO1-deficient fibroblasts and (B) MMS19-deficient fibroblasts. The blue and orange symbols represent significantly decreased and increased protein abundance, respectively. The most significantly changed proteins and known iron-sulfur proteins are labeled. The 3 horizontal dotted lines indicate significance cutoff P values of .05, .01, and .001, respectively. The 2 vertical dotted lines indicate log2(fold change) −2 and 2, respectively. C and D. Enrichment analysis showing the affected pathways in CIAO1- (C) and MMS19 (D)-deficient fibroblasts. The enrichment ratio reflects the number of significantly altered proteins versus the expected number of altered proteins for a given enrichment set. Pathways associated with bacterial and viral infections are depicted in red. |
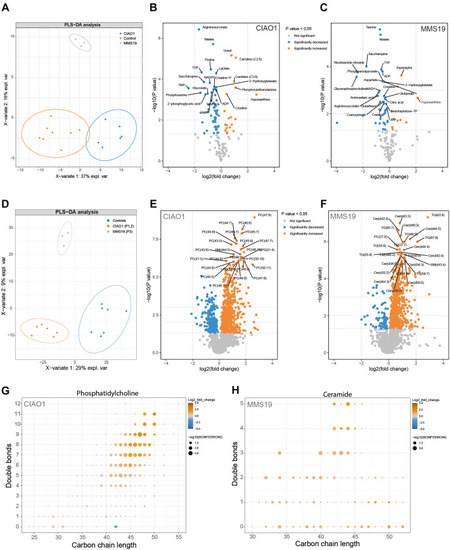
Altered metabolome and lipidome in CIAO1- and MMS19-deficient fibroblasts. A. PLS-DA analysis shows a clear distinction between the metabolome of CIAO1, MMS19, and control fibroblasts. B and C. Volcano plot depicting the metabolomics data in CIAO1 (B) and MMS19 deficient fibroblasts (C). Significance cutoff is shown in the legend of the volcano plot. The 25 most changed metabolites based on P value are labeled. The 3 horizontal dotted lines indicate P value .05, .01, and .001, respectively. The 2 vertical dotted lines indicate log2(fold change) −2 and 2, respectively. D. PLS-DA analysis shows a clear distinction between the lipidome of CIAO1, MMS19, and control fibroblasts. E and F. Volcano plot depicting the lipidomics data in CIAO1 (E) and MMS19 deficient fibroblasts (F). Significance cutoff is shown in the legend of the volcano plot. The 50 most changed metabolites based on P value are labeled. The 3 horizontal dotted lines indicate P value .05, .01, and .001, respectively. The 2 vertical dotted lines indicate log2(fold change) −2 and 2, respectively. G and H. The carbon-chain length of phosphatidylcholine and ceramide plotted versus the total number of double bonds in those chains. Changes in the phosphatidylcholine in CIAO1-deficient fibroblasts (G) and ceramide composition in MMS19-deficient fibroblasts (H) versus controls show significant increases of phospholipids with long carbon-chain length and double bonds. |
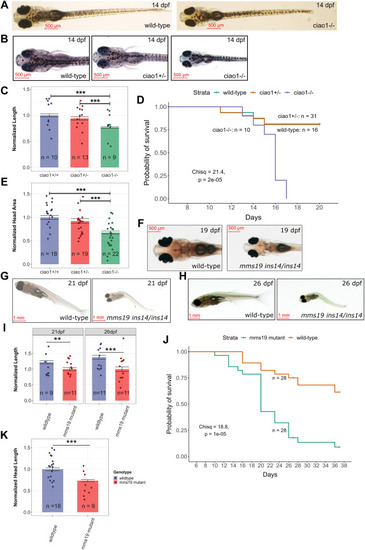
ciao1−/− and mms19 −/− zebrafish phenotypes. A. Whole-body images of representative wild-type and ciao1−/− larvae at 14 dpf. B. Head images of representative wild-type, ciao1+/−, and ciao1−/− larvae at 14 dpf. C. Graph of larval lengths of zebrafish with different ciao1 genotypes at 14 dpf, wild type, n = 10; ciao1+/−, n = 13; ciao1−/−, n = 9. D. Kaplan-Meier survival plot showing early death in the homozygous mutants ciao1−/−, n = 10; ciao1+/−, n = 31; wild type, n = 16. E. Graph of head areas of zebrafish with different ciao1 genotypes at 14 dpf, wild type, n = 18; ciao1+/−, n = 19; ciao1−/−, n = 22. F. Representative head images of wild-type and mms19ins14/ins14 mutants at 19 dpf. Overall morphology of the wild-type and mms19ins14/ins14 mutants at 21 dpf (G) and 26 dpf (H) demonstrates serious abnormalities of the mutant adults. I. Normalized length (by mutant mean) quantification of wild-type and mms19ins14/ins14 juveniles at 21 and 26 dpf, 21 dpf: wild type, n = 9 and mms19ins14/ins14, n = 11; 26 dpf: wild type, n = 11 and mms19ins14/ins14, n = 11. J. Kaplan-Meier survival curves of the wild-type and mms19ins14/ins14 juvenile zebrafish adults are significantly different (χ2 = 18.8; P value = 10−5), wild type, n = 28 and mms19ins14/ins14, n = 28. K. Normalized head length (by wild-type mean) quantification of mms19 mutant and wild-type juveniles at 19 dpf, wild type, n = 18 and mms19ins14/ins14, n = 9. Statistical significances of the differences between the groups in (C), (E), (I), and (K) were calculated using one-way ANOVA including the Tukey’s post-hoc test. Legend: ∗∗P < .01; ∗∗∗P ≤ .001. In all graphs, bars indicate mean values and error bars indicate standard errors of the mean. Scale bars (500 μm or 1 mm) on all zebrafish images indicate their actual sizes. PHENOTYPE:
|

ZFIN is incorporating published figure images and captions as part of an ongoing project. Figures from some publications have not yet been curated, or are not available for display because of copyright restrictions. EXPRESSION / LABELING:
PHENOTYPE:
|
|
ZFIN is incorporating published figure images and captions as part of an ongoing project. Figures from some publications have not yet been curated, or are not available for display because of copyright restrictions. |