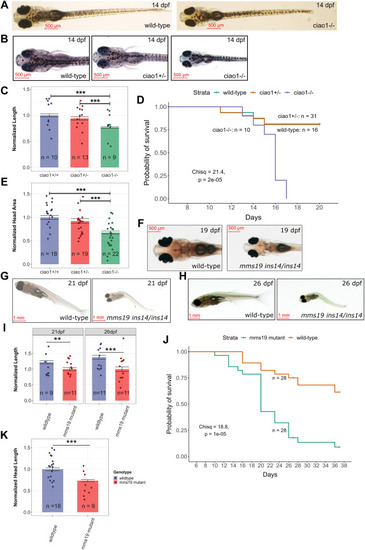
ciao1−/− and mms19 −/− zebrafish phenotypes. A. Whole-body images of representative wild-type and ciao1−/− larvae at 14 dpf. B. Head images of representative wild-type, ciao1+/−, and ciao1−/− larvae at 14 dpf. C. Graph of larval lengths of zebrafish with different ciao1 genotypes at 14 dpf, wild type, n = 10; ciao1+/−, n = 13; ciao1−/−, n = 9. D. Kaplan-Meier survival plot showing early death in the homozygous mutants ciao1−/−, n = 10; ciao1+/−, n = 31; wild type, n = 16. E. Graph of head areas of zebrafish with different ciao1 genotypes at 14 dpf, wild type, n = 18; ciao1+/−, n = 19; ciao1−/−, n = 22. F. Representative head images of wild-type and mms19ins14/ins14 mutants at 19 dpf. Overall morphology of the wild-type and mms19ins14/ins14 mutants at 21 dpf (G) and 26 dpf (H) demonstrates serious abnormalities of the mutant adults. I. Normalized length (by mutant mean) quantification of wild-type and mms19ins14/ins14 juveniles at 21 and 26 dpf, 21 dpf: wild type, n = 9 and mms19ins14/ins14, n = 11; 26 dpf: wild type, n = 11 and mms19ins14/ins14, n = 11. J. Kaplan-Meier survival curves of the wild-type and mms19ins14/ins14 juvenile zebrafish adults are significantly different (χ2 = 18.8; P value = 10−5), wild type, n = 28 and mms19ins14/ins14, n = 28. K. Normalized head length (by wild-type mean) quantification of mms19 mutant and wild-type juveniles at 19 dpf, wild type, n = 18 and mms19ins14/ins14, n = 9. Statistical significances of the differences between the groups in (C), (E), (I), and (K) were calculated using one-way ANOVA including the Tukey’s post-hoc test. Legend: ∗∗P < .01; ∗∗∗P ≤ .001. In all graphs, bars indicate mean values and error bars indicate standard errors of the mean. Scale bars (500 μm or 1 mm) on all zebrafish images indicate their actual sizes.
|
