
Fig. 3
- ID
- ZDB-IMAGE-240621-61
- Publication
- van Karnebeek et al., 2024 - CIAO1 and MMS19 deficiency: a lethal neurodegenerative phenotype caused by cytosolic Fe-S cluster protein assembly disorders
- All Figures
- Figures for van Karnebeek et al., 2024
|
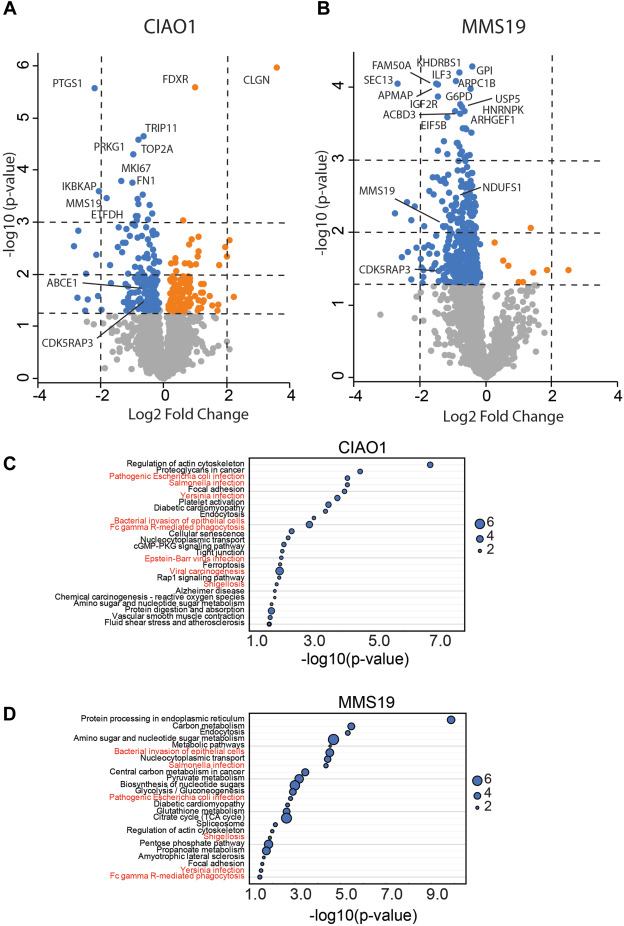
Fig. 3 Volcano plot depicting proteomics data in CIAO1 and MMS19 deficient fibroblasts. (A) CIAO1-deficient fibroblasts and (B) MMS19-deficient fibroblasts. The blue and orange symbols represent significantly decreased and increased protein abundance, respectively. The most significantly changed proteins and known iron-sulfur proteins are labeled. The 3 horizontal dotted lines indicate significance cutoff P values of .05, .01, and .001, respectively. The 2 vertical dotted lines indicate log2(fold change) −2 and 2, respectively. C and D. Enrichment analysis showing the affected pathways in CIAO1- (C) and MMS19 (D)-deficient fibroblasts. The enrichment ratio reflects the number of significantly altered proteins versus the expected number of altered proteins for a given enrichment set. Pathways associated with bacterial and viral infections are depicted in red.