
Fig. 4
- ID
- ZDB-FIG-240621-62
- Publication
- van Karnebeek et al., 2024 - CIAO1 and MMS19 deficiency: a lethal neurodegenerative phenotype caused by cytosolic Fe-S cluster protein assembly disorders
- Other Figures
- All Figure Page
- Back to All Figure Page
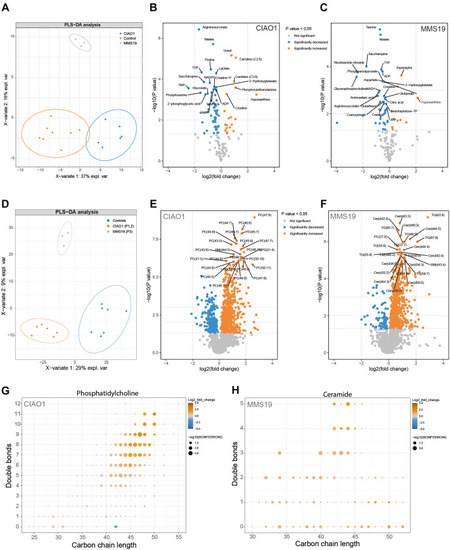
Altered metabolome and lipidome in CIAO1- and MMS19-deficient fibroblasts. A. PLS-DA analysis shows a clear distinction between the metabolome of CIAO1, MMS19, and control fibroblasts. B and C. Volcano plot depicting the metabolomics data in CIAO1 (B) and MMS19 deficient fibroblasts (C). Significance cutoff is shown in the legend of the volcano plot. The 25 most changed metabolites based on P value are labeled. The 3 horizontal dotted lines indicate P value .05, .01, and .001, respectively. The 2 vertical dotted lines indicate log2(fold change) −2 and 2, respectively. D. PLS-DA analysis shows a clear distinction between the lipidome of CIAO1, MMS19, and control fibroblasts. E and F. Volcano plot depicting the lipidomics data in CIAO1 (E) and MMS19 deficient fibroblasts (F). Significance cutoff is shown in the legend of the volcano plot. The 50 most changed metabolites based on P value are labeled. The 3 horizontal dotted lines indicate P value .05, .01, and .001, respectively. The 2 vertical dotted lines indicate log2(fold change) −2 and 2, respectively. G and H. The carbon-chain length of phosphatidylcholine and ceramide plotted versus the total number of double bonds in those chains. Changes in the phosphatidylcholine in CIAO1-deficient fibroblasts (G) and ceramide composition in MMS19-deficient fibroblasts (H) versus controls show significant increases of phospholipids with long carbon-chain length and double bonds. |