
- Title
-
Contribution of the eye and of opn4xa function to circadian photoentrainment in the diurnal zebrafish
- Authors
- Chaigne, C., Sapède, D., Cousin, X., Sanchou, L., Blader, P., Cau, E.
- Source
- Full text @ PLoS Genet.
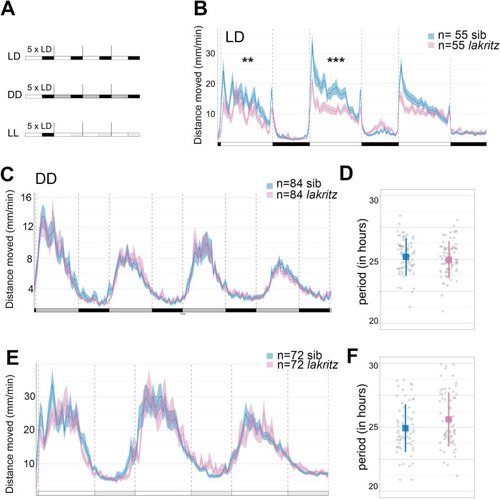
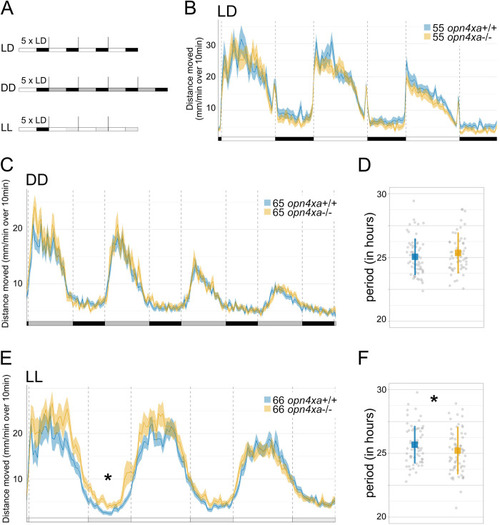
Locomotor activity of larvae devoid of RGCs in LD, DD and LL. |
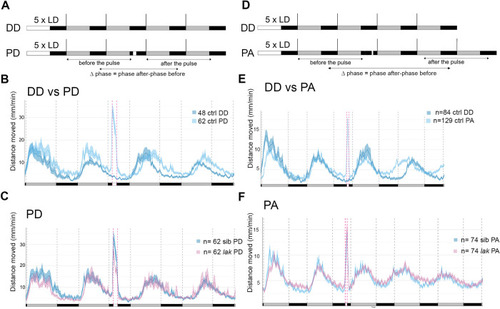
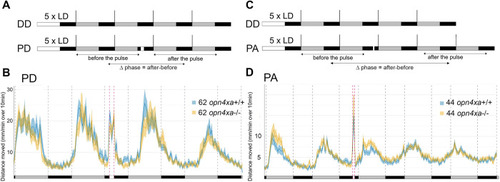
Larvae devoid of RGCs still photoentrain to pulses of white light at CT16 and CT21. |
|
|
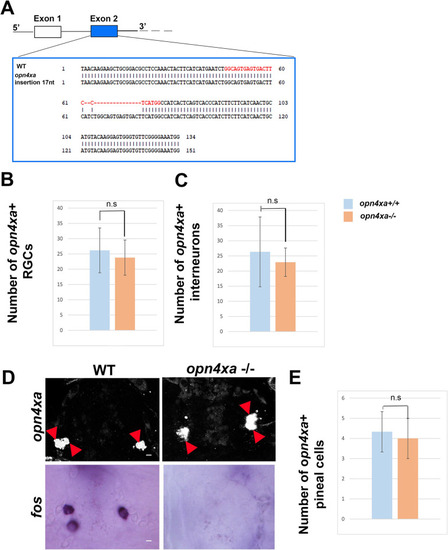
Locomotor activity of larvae devoid of |
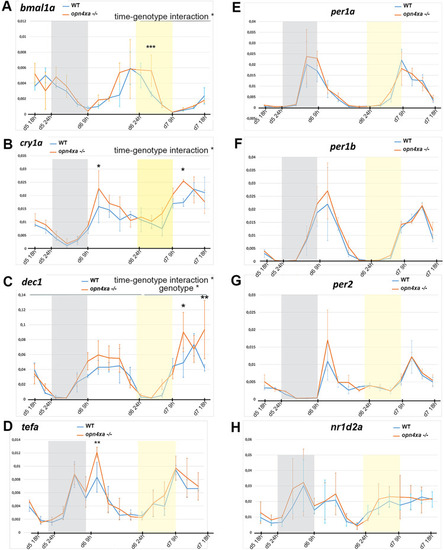
Mean expression relative to beta actin ± s.d. Three pools of larvae were used for each time point. ‘wt’ refers to pool of larvae from crosses of |
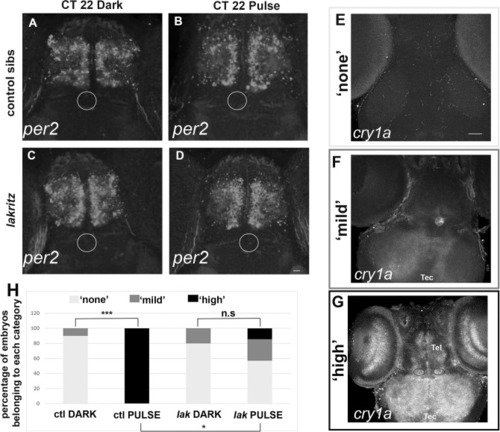
Larvae devoid of |
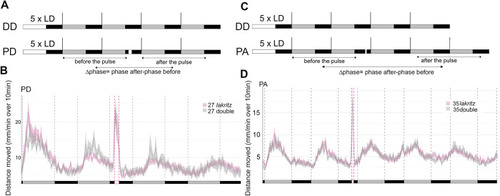
Larvae devoid of RGCs and |