|
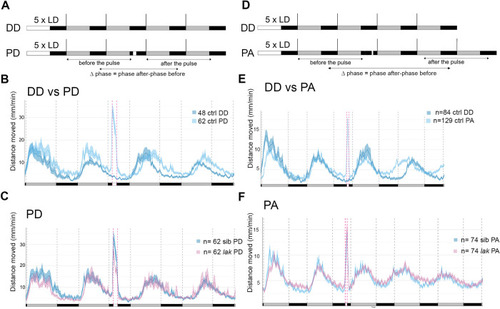
Larvae devoid of RGCs still photoentrain to pulses of white light at CT16 and CT21. A) Experimental design of phase delay (PD) experiments. White rectangles represent the day or light pulse period, black rectangles represent the night period and dark grey rectangles represent the subjective day. For each experiment, larvae are entrained for 5 LD cycles, the larvae are therefore 5dpf at the beginning of locomotor activity measurements. Locomotor activity is tracked either in constant darkness for 4 days (DD) or tracked in constant darkness for 4 days and subjected to a 2-hours pulse of light during the night of the 2nd day of constant darkness at CT16 (PD). The phase of locomotor activity is calculated for each larva before and after the timing of the pulse for DD and PD experiments and the Δphase (phase after the pulse–phase before the pulse) is calculated. B) Average distance moved by control larvae (mm/min over 10min) in DD and PD experiments. Mean ± SE. The Δphase calculated using the FFT-NLLS method of PD larvae is higher than the one of DD larvae (p<0.0001, Mann-Whitney two-tailed test), showing that the pulse of light induced a phase delay. C) Average distance moved merged from PD experiments represented in 10 min bins. Mean ± SE. The Δphase of control versus lak larvae calculated using the FFT-NLLS method is not significantly different (p = 0.24, Mann-Whitney two-tailed test). lak show lower levels of activity during the light pulse (p = 0.03, Mann-Whitney two-tailed test). D) Experimental design of phase advance (PA) experiments. The iconography is similar to A). PA-pulsed larvae were subjected to a one-hour pulse of light at CT21. E) Average distance moved of control larvae (mm/min over 10min) in DD and PD experiments Mean ± SE. The Δphase calculated using the FFT-NLLS method is negative in PA-pulsed larvae and statistically different from DD larvae (p<0.0001, Mann-Whitney two-tailed test), showing that the pulse of light induced a phase advance. F) Average distance moved merged from PA experiments represented in 10 min bins. Mean ± SE.
|