IMAGE

Fig 1

ID
ZDB-IMAGE-240308-21
Source
Figures for Chaigne et al., 2024
Image
Figure Caption

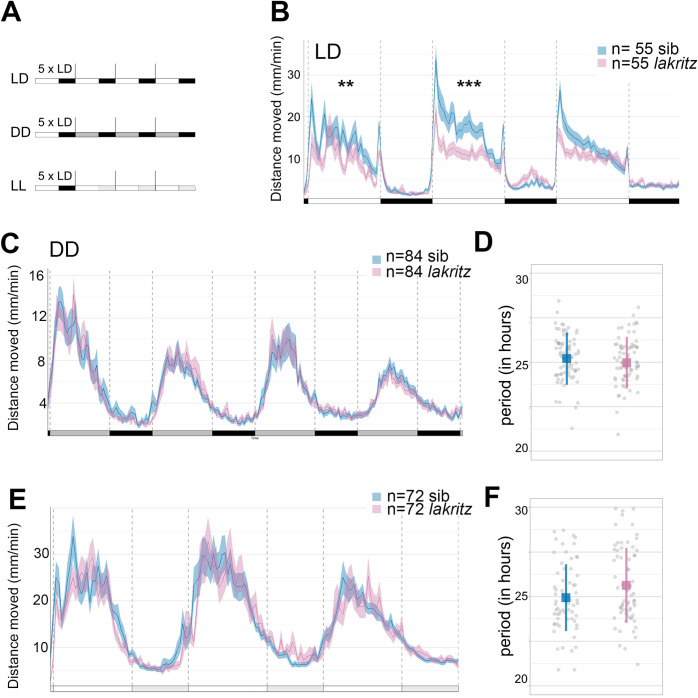
Fig 1 Locomotor activity of larvae devoid of RGCs in LD, DD and LL.

A) Experimental design of LD, DD and LL experiments. White rectangles represent the day period, while black rectangles represent the night period, light grey rectangles represent the subjective day period and dark grey rectangles the subjective night. For each experiment, larvae are entrained for 5 LD cycles and their locomotor activity is tracked either in LD (LD), constant darkness (DD) or constant light (LL) the larvae are therefore 5dpf at the beginning of locomotor activity measurements. B) Average distance moved (mm/min) In LD. Merged data from 3 independent experiments represented in 10 min bins. Error bars represent SE. The distance moved is lower in lak larvae than control sibling larvae during the 1st (p = 0.008) and 2nd days (p = 0.005) but not during the 3rd day (p = 0.13) nor during the night (p = 0.42, p = 0.51 and p = 0.57 for the 1st, 2nd and 3rd nights. The lack of a phenotype of lak larvae in the third light phase could be linked to the overall state of the larvae as they are not fed during the experiment; Mann-Whitney two-tailed test), see S1 Table. * P<0.05, **p<0.01, ***p<0.005. C) Average distance moved in DD. Merged data from 3 independent experiments represented in 10 min bins. Error bars represent SE. No differences are detected between the distance moved of siblings versus lak larvae using a Mann-Whitney two-tailed test for each subjective night or day, see S2 Table. D) Estimation of the periods using the FFT-NLLS method. Calculations were made on four complete cycles in DD. The mean period is not significantly different between sibling and lak larvae in DD (control: 25.08 ± 1.59 hours (n = 114), lak: 24.95 ± 1.44 hours (n = 83); mean ± S.D; p = 0.32; Mann-Whitney two-tailed test, sibling vs lak larvae). Each grey point represents a single larva. E) Average distance moved in LL. Merged data from 3 independent experiments represented in 10 min bins. Error bars represent SE. F) Estimation of the periods using the FFT-NLLS method. Calculations were made on three complete cycles in LL. Mean± sd (in hours) is represented. Each grey point represents a larva, n = 66 siblings, n = 68 lak larvae.

Acknowledgments
This image is the copyrighted work of the attributed author or publisher, and ZFIN has permission only to display this image to its users. Additional permissions should be obtained from the applicable author or publisher of the image. Full text @ PLoS Genet.