FIGURE SUMMARY
Title

Syringaldehyde Exhibits Antibacterial and Antioxidant Activities against Mycobacterium marinum Infection

Authors
Wen, D., Meng, C., Feng, Y., Shen, L., Liu, Y., Sun, W., Chen, G., Wu, C.
Source
Full text @ Microorganisms

(A) Magnolia officinalis. [online image], 2018, 360doc. www.360doc.com/content/18/0429/09/42668302_749620463.shtml, accessed on 29 April 2018. (B) Manihot esculenta. [online image], 2018. http://www.360doc.com/content/22/0830/10/153132_1045851273.shtml, accessed on 7 December 2018. (C) SA, a light beige powder. [online image]. www.chemicalbook.com/SupplyInfo_1024189.htm, accessed on 16 March 2021. (D) The chemical structure of SA (3,5-dimethoxy-4-hydroxybenzaldehyde, C9H10O4).

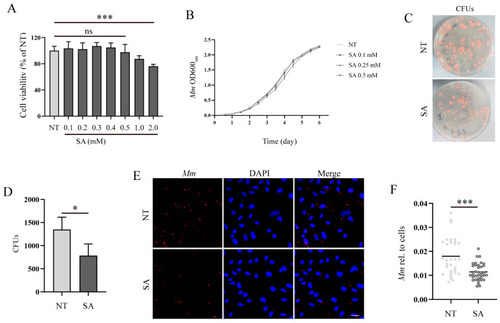
SA increases the resistance of lung epithelial cells to Mm infection. (A) The effect of various concentrations of SA on A549 cell viability; “ns” denotes “no significance” (n = 6). (B) The growth curve of Mm cultured with 0.1, 0.25, and 0.5 mM SA for 6 days (n = 3). (C,D) The CFU assays analyzing the effects of SA on Mm infection in A549 cells (n ≥ 9). (E) The efficiency of Mm infection in cells with pretreatment of 0.5 mM SA was determined by confocal microscope. Mm (red) represents tdTomato Mm, DAPI (blue) represents cell nuclei. Multiplicity of infection (MOI) = 10:1; the images are 20×; scale bar: 20 μm (n ≥ 31). (F) The Mm immunofluorescence intensity was quantified using ImageJ software; the results represent the area of Mm/the area of the cell nucleus (n ≥ 31). Means ± SEM; * p < 0.05 and *** p < 0.001.

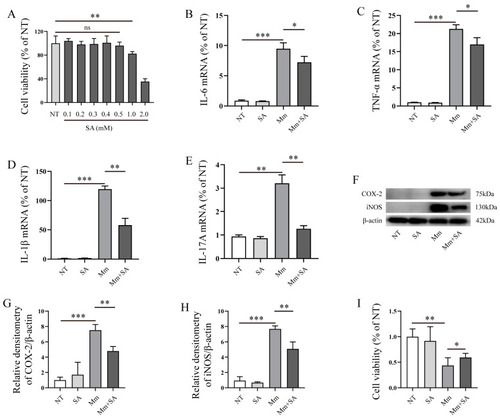
SA inhibits the inflammatory response induced by Mm infection. (A) The effect of different concentrations of SA on RAW264.7 cell viability; “no significance, ns” (n = 6). (BE) qRT-PCR detection of the mRNA levels of IL-6, TNF-α, IL-1β, and IL-17A in RAW264.7 cells after Mm infection or the addition of 0.5 mM SA (n = 3). (FH) Western blotting analysis of the effects of 0.5 mM SA on iNOS and COX-2 expression in macrophages after Mm infection (n = 3). (I) RAW264.7 cell viability, cells treated with Mm and 0.5 mM SA-pretreated Mm. Means ± SEM; * p < 0.05, ** p < 0.01, and *** p < 0.001.

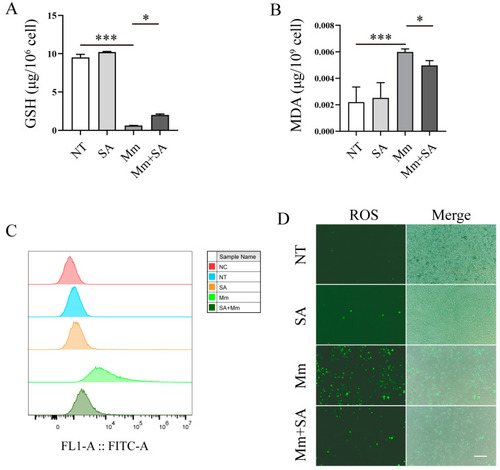
SA alleviates oxidative stress in
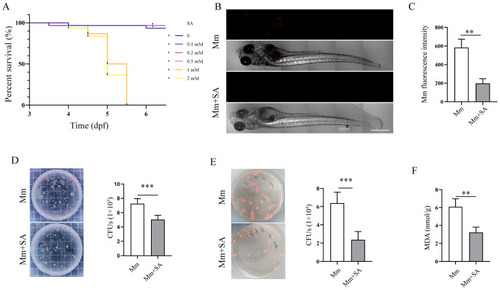
 Mm-infected macrophages. (A,B) The cellular levels of MDA and GSH in SA-treated and Mm-treated macrophages (n = 3). (C,D) The effects of SA on the production of ROS in Mm-infection-induced macrophages, determined using flow cytometry and fluorescence microscopy (n = 3); the images are 20×; scale bar: 50 μm. Means ± SEM; * p < 0.05 and *** p < 0.001.

SA inhibits Mm proliferation and alleviates Mm-infection-induced oxidative stress in zebrafish. (A) The effects of different doses of SA on the survival of zebrafish larvae. (B) Imaging of Mm-infected zebrafish using laser scanning confocal microscope; the images are 10×; scale bar: 500 μm. (C) The statistics of B results. (n ≥ 6) (D) CFU assays analyzing the impact of 0.5 mM SA on the Mm load in zebrafish (n = 6). (E) CFU assays analyzing the effect of 0.5 mM SA on A549 cells after Mm infection. (F) The levels of MDA in the tissue homogenate of SA-treated and Mm-infected zebrafish (n = 3). Means ± SEM; ** p < 0.01 and *** p < 0.001.

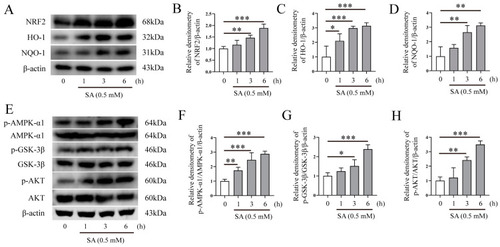
SA activates AMPK-α1/AKT/GSK-3β and NRF2/HO-1/NQO-1 signaling pathways. (AD) Western blotting analysis of the effects of 0.5 mM SA on NRF2, HO-1, and NQO-1 protein expression in RAW264.7 cells (n = 3). (EH) Western blotting analysis of the effects of 0.5 mM SA on the AMPK-α1, GSK-3β, and AKT signaling pathway in RAW264.7 cells (n = 3). Means ± SEM; * p < 0.05, ** p < 0.01, and *** p < 0.001.

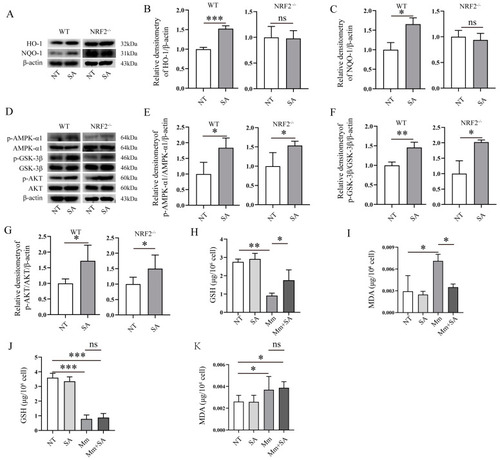
The antioxidative activity of SA depends on NRF2 in Mm-infected macrophages. (AC) Western blotting analysis of the effects of 0.5 mM SA on the protein expression of HO-1 and NQO-1 in Mm-infected macrophages isolated from WT and NRF2−/− mice (n = 3). (DG) Western blotting analysis of the effects of 0.5 mM SA on the AMPK-α1, GSK-3β, and AKT signaling pathway in Mm-infected macrophages isolated from WT and NRF2−/− mice (n = 3). (H,I) The levels of GSH and MDA in Mm-infected macrophages isolated from WT mice (n = 3). (J,K) The levels of GSH and MDA in Mm-infected macrophages isolated from NRF2−/− mice (n = 3). Means ± SEM; no significance, ns; * p < 0.05, ** p < 0.01, and *** p < 0.001.

Acknowledgments
This image is the copyrighted work of the attributed author or publisher, and ZFIN has permission only to display this image to its users. Additional permissions should be obtained from the applicable author or publisher of the image. Full text @ Microorganisms