IMAGE

Figure 2

ID
ZDB-IMAGE-240226-166
Source
Figures for Wen et al., 2024
Image
Figure Caption

Figure 2

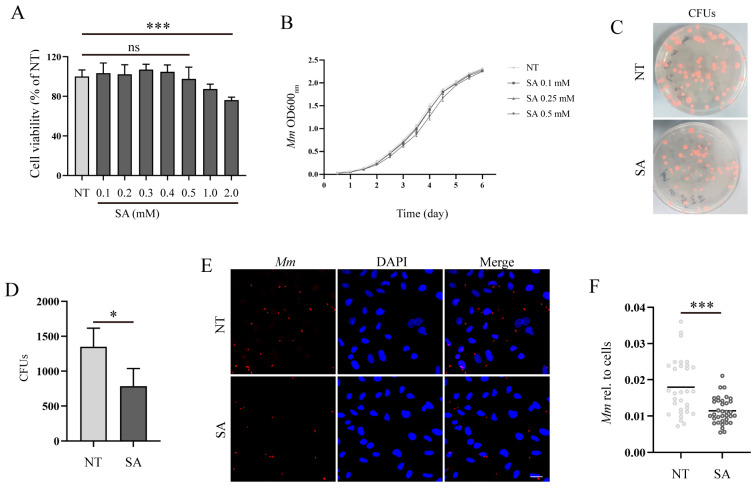
SA increases the resistance of lung epithelial cells to Mm infection. (A) The effect of various concentrations of SA on A549 cell viability; “ns” denotes “no significance” (n = 6). (B) The growth curve of Mm cultured with 0.1, 0.25, and 0.5 mM SA for 6 days (n = 3). (C,D) The CFU assays analyzing the effects of SA on Mm infection in A549 cells (n ≥ 9). (E) The efficiency of Mm infection in cells with pretreatment of 0.5 mM SA was determined by confocal microscope. Mm (red) represents tdTomato Mm, DAPI (blue) represents cell nuclei. Multiplicity of infection (MOI) = 10:1; the images are 20×; scale bar: 20 μm (n ≥ 31). (F) The Mm immunofluorescence intensity was quantified using ImageJ software; the results represent the area of Mm/the area of the cell nucleus (n ≥ 31). Means ± SEM; * p < 0.05 and *** p < 0.001.

Acknowledgments
This image is the copyrighted work of the attributed author or publisher, and ZFIN has permission only to display this image to its users. Additional permissions should be obtained from the applicable author or publisher of the image. Full text @ Microorganisms