FIGURE SUMMARY
Title

RhoB expression associated with chemotherapy response and prognosis in colorectal cancer

Authors
Kopsida, M., Liu, N., Kotti, A., Wang, J., Jensen, L., Jothimani, G., Hildesjo, C., Haapaniemi, S., Zhong, W., Pathak, S., Sun, X.F.
Source
Full text @ Cancer Cell Int.

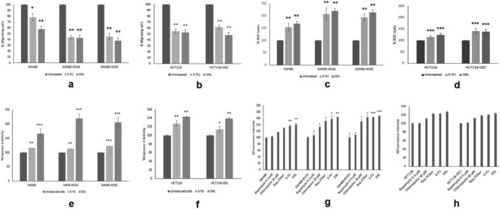
Assessment of 5-fluoouracial (5-FU) and oxaliplatin (OXL) treatment on cell migration, reactive oxygen species (ROS) levels, caspases-3 activity and autophagy in SW480, SW480-KO16, SW480-KO55, HCT116 and HCT116-OE cells. ab Cell migration in SW480, SW480-KO16, SW480-KO55, HCT116 and HCT116-OE cells after treatment with 5-FU and OXL (IC50 values) for 72 h at 37 °C. Cells were seeded in FBS free medium in migration chambers and were placed in 24 well plates with FBS containing medium. Migration was determined by counting the cells migrated after 72 h. DMSO was used as positive control. Data presented as mean ± SEM of 3 independent experiments (n = 5). *P < 0.05, **P < 0.01, compared to SW480 and HCT116; cd Quantification of reactive oxygen species (ROS) levels in SW480, SW480-KO16, SW480-KO55, HCT116 and HCT116-OE cells after treatment with 5-FU and OXL (IC50 values) for 72 h at 37 °C. The percentage of ROS production was calculated by measuring the fluorescence intensity. DMSO was used as positive control. Data presented as mean ± SD (n = 3). *P < 0.05, **P < 0.01, ***P < 0.001 compared to SW480 and HCT116, respectively; ef Caspase-3 activity in SW480, SW480-KO16, SW480-KO55, HCT116, HCT116-OE1 and HCT116-OE2 cells after treatment with 5-FU and OXL (IC50 values) for 72 h at 37 °C. DMSO was used as positive control. Data presented as mean ± SEM (n = 3). *P < 0.05, **P < 0.01, ***P < 0.001, compared to SW480 and HCT116, respectively; and (g-h) Detection of autophagy in SW480, SW480-KO16, SW480-KO55, HCT116 and HCT116-OE cells after treatment with 0.5 µM rapamycin, 10 µM Chloroquine, 0.5 µM Rapamycin + 10 µM Chloroquine, 5-FU and OXL (IC50 values). DMSO was used as positive control. Data presented as mean ± SEM (n = 3). *P < 0.05, compared to SW480 and HCT116, respectively

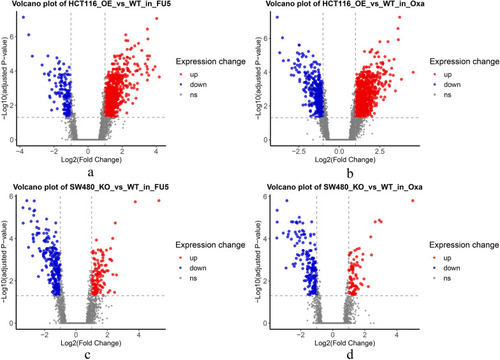
RNA sequencing analysis on the HCT116-OE, HCT116-WT, SW480-KO and SW480-WT cells treated with 5-fluoouracial (5-FU) and oxaliplatin (OXL). Differential gene expression analysis of HCT116 and SW480 cells treated with 5-FU and OXL and represented in the volcano plot. a HCT116 OE vs wild type (WT) in 5-FU treatment; b HCT116 OE vs WT in oxaliplatin treatment; c SW480 knockout (KO) vs WT in 5-FU treatment, and d SW480 KO vs WT in OXL treatment

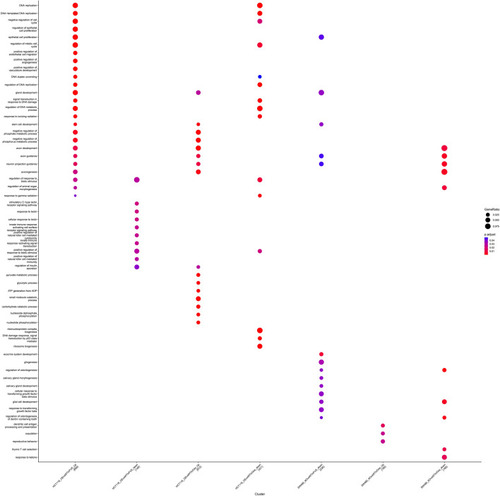
Gene ontology (GO) biological process enrichment analysis of DEGs in HCT116 and SW480 cells after treatment with 5-fluorouracil (5-FU) and oxaliplatin (OXL)

Network analysis of DEGs in HCT116 and SW480 cells treated with 5-fluorouracil (5-FU) and oxaliplatin (OXL). Network analysis of DEGs in HCT116 and SW480 cells treated with 5-fluorouracil (5-FU) and oxaliplatin (OXL). a HCT116 OE vs wild type (WT) in 5-FU treatment; b HCT116 OE vs WT in oxaliplatin (OXL) treatment; c SW480 knockout (KO) vs. WT in 5-FU treatment, and d SW480 KO vs WT in OXL treatment

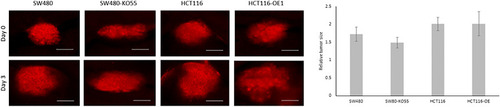
Fluorescent microscopy images and quantification of tumor growth in zebrafish xenograft model. Fluorescent microscopy images of SW480, SW480-KO55, and HCT116 and HCT116-OE tumor xenografts (shown in red). The pictures were taken directly after implantation (day 0) in 2-day old zebrafish larvae and 3 days after implantation (day 3). Size-bars in primary tumors correspond to 100 µm. Quantifications of relative tumor volumes indicate the primary tumor size at day 3 relative to day 0

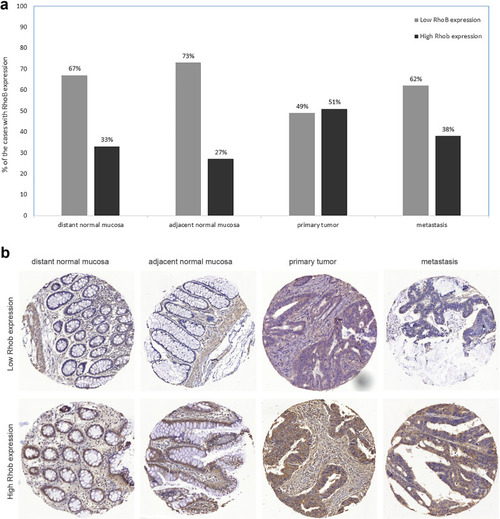
RhoB expression in distant normal mucosa, adjacent normal mucosa, primary tumor, and lymph node metastasis of colorectal cancer patients; a the percentage of the cases with RhoB low and high expression and b the representative immunohistochemical staining of RhoB low and high expression

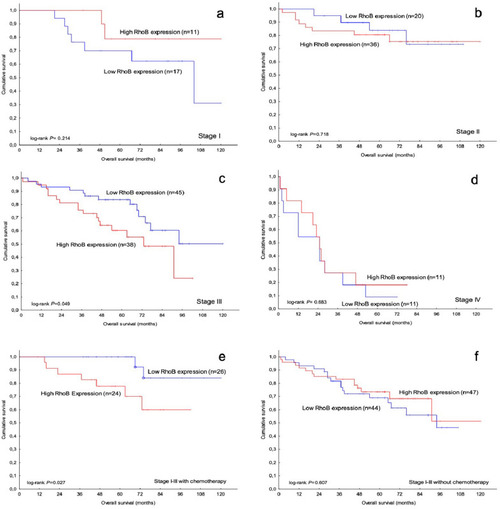
RhoB expression in colorectal cancer in relation to patient overall survival with different stage and treatment; a stage I; b stage II; c stage III and d stage IV; as well as e stage I-III with chemotherapy and f stage I-III without chemotherapy

Molecular Docking study ac molecular interaction analysis of RhoB protein with 5-fluorouraci (5-FU) by molecular docking; df molecular interaction analysis of RhoB protein with oxaliplatin (OXL) by molecular docking

Protein interaction study ab protein–protein interaction analysis of RhoB protein with caspase 3 protein using HADDOCK and visualized with PYMOL; and c 2D interaction map of interacting amino acids of RhoB protein with caspase 3 protein using LigPlot

Acknowledgments
This image is the copyrighted work of the attributed author or publisher, and ZFIN has permission only to display this image to its users. Additional permissions should be obtained from the applicable author or publisher of the image. Full text @ Cancer Cell Int.