
FIGURE
Fig. 2
Fig. 2
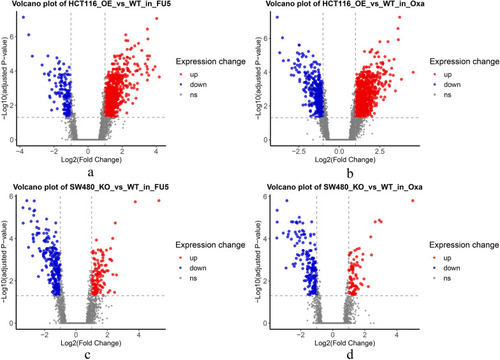
RNA sequencing analysis on the HCT116-OE, HCT116-WT, SW480-KO and SW480-WT cells treated with 5-fluoouracial (5-FU) and oxaliplatin (OXL). Differential gene expression analysis of HCT116 and SW480 cells treated with 5-FU and OXL and represented in the volcano plot. |
Expression Data
Expression Detail
Antibody Labeling
Phenotype Data
Phenotype Detail
Acknowledgments
This image is the copyrighted work of the attributed author or publisher, and
ZFIN has permission only to display this image to its users.
Additional permissions should be obtained from the applicable author or publisher of the image.
Full text @ Cancer Cell Int.