
Image
|
Figure Caption
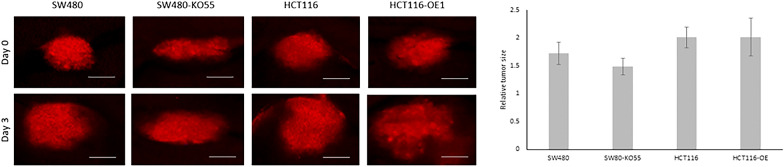
Fig. 5
Fluorescent microscopy images and quantification of tumor growth in zebrafish xenograft model. Fluorescent microscopy images of SW480, SW480-KO55, and HCT116 and HCT116-OE tumor xenografts (shown in red). The pictures were taken directly after implantation (day 0) in 2-day old zebrafish
Acknowledgments
This image is the copyrighted work of the attributed author or publisher, and
ZFIN has permission only to display this image to its users.
Additional permissions should be obtained from the applicable author or publisher of the image.
Full text @ Cancer Cell Int.