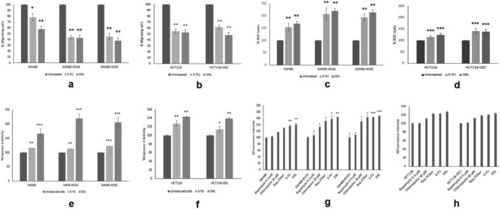
Assessment of 5-fluoouracial (5-FU) and oxaliplatin (OXL) treatment on cell migration, reactive oxygen species (ROS) levels, caspases-3 activity and autophagy in SW480, SW480-KO16, SW480-KO55, HCT116 and HCT116-OE cells. a–b Cell migration in SW480, SW480-KO16, SW480-KO55, HCT116 and HCT116-OE cells after treatment with 5-FU and OXL (IC50 values) for 72 h at 37 °C. Cells were seeded in FBS free medium in migration chambers and were placed in 24 well plates with FBS containing medium. Migration was determined by counting the cells migrated after 72 h. DMSO was used as positive control. Data presented as mean ± SEM of 3 independent experiments (n = 5). *P < 0.05, **P < 0.01, compared to SW480 and HCT116; c–d Quantification of reactive oxygen species (ROS) levels in SW480, SW480-KO16, SW480-KO55, HCT116 and HCT116-OE cells after treatment with 5-FU and OXL (IC50 values) for 72 h at 37 °C. The percentage of ROS production was calculated by measuring the fluorescence intensity. DMSO was used as positive control. Data presented as mean ± SD (n = 3). *P < 0.05, **P < 0.01, ***P < 0.001 compared to SW480 and HCT116, respectively; e–f Caspase-3 activity in SW480, SW480-KO16, SW480-KO55, HCT116, HCT116-OE1 and HCT116-OE2 cells after treatment with 5-FU and OXL (IC50 values) for 72 h at 37 °C. DMSO was used as positive control. Data presented as mean ± SEM (n = 3). *P < 0.05, **P < 0.01, ***P < 0.001, compared to SW480 and HCT116, respectively; and (g-h) Detection of autophagy in SW480, SW480-KO16, SW480-KO55, HCT116 and HCT116-OE cells after treatment with 0.5 µM rapamycin, 10 µM Chloroquine, 0.5 µM Rapamycin + 10 µM Chloroquine, 5-FU and OXL (IC50 values). DMSO was used as positive control. Data presented as mean ± SEM (n = 3). *P < 0.05, compared to SW480 and HCT116, respectively
|
