
Image
|
Figure Caption
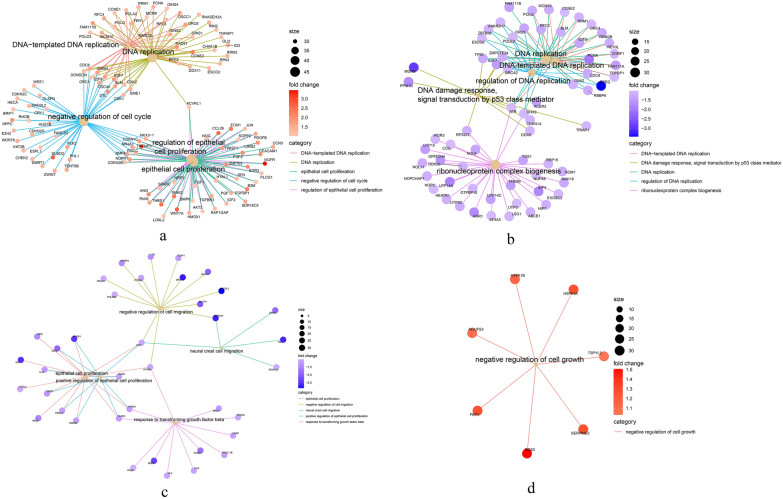
Fig. 4
Network analysis of DEGs in HCT116 and SW480 cells treated with 5-fluorouracil (5-FU) and oxaliplatin (OXL). Network analysis of DEGs in HCT116 and SW480 cells treated with 5-fluorouracil (5-FU) and oxaliplatin (OXL).
Acknowledgments
This image is the copyrighted work of the attributed author or publisher, and
ZFIN has permission only to display this image to its users.
Additional permissions should be obtained from the applicable author or publisher of the image.
Full text @ Cancer Cell Int.