
- Title
-
DNA hypomethylation activates Cdk4/6 and Atr to induce DNA replication and cell cycle arrest to constrain liver outgrowth in zebrafish
- Authors
- Madakashira, B.P., Magnani, E., Ranjan, S., Sadler, K.C.
- Source
- Full text @ Nucleic Acids Res.
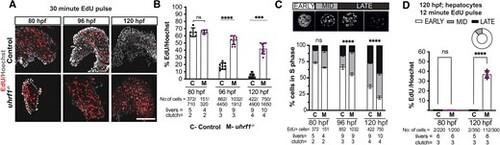
uhrf1 mutant hepatocytes accumulate in late S-phase with increased DNA replication. (A) Representative Z-stack projection confocal images of EdU and Hoechst stained control and uhrf1−/− livers. Control and uhrf1−/− embryos were pulsed with EdU for 30 min at 80 hpf, 96 hpf and 120 hpf and processed for EdU fluorescence by Click-it. (B) Quantification of EdU incorporation in A. (C) 80 hpf, 96 hpf and 120 hpf hepatocytes were sorted into early, mid and late S phase based on EdU pattern and quantified. (D) Quantification of EdU incorporation from a 12 min EdU pulse at 80 hpf and 120 hpf control and uhrf1−/− hepatocytes. Pie chart represents percentage of hepatocytes in each stage of S phase. Scale bar = 50 μm, the number of samples and clutches indicated for each condition and represented as median with range. P-value *< 0.05, **< 0.005, *** < 0.0005 by unpaired Student's t-test with adjustment for multiple comparisons. |
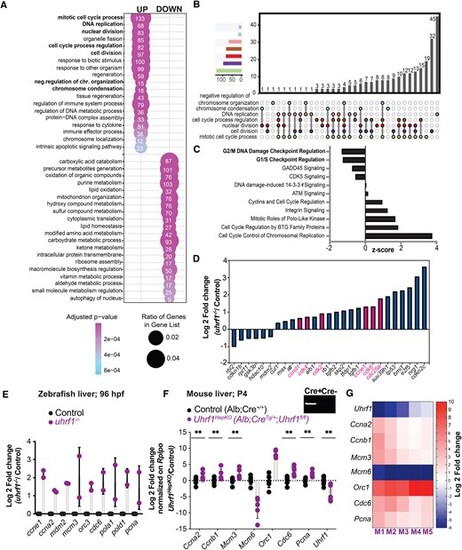
CDK4/6 is activated in uhrf1 mutant livers. (A) Gene ontology (REVIGO) of the significant upregulated and downregulated genes in 120 hpf uhrf1−/− liver RNA-Seq (P-adj < 0.05) for each category. The cell cycle GO terms are highlighted in bold. (B) UPSET plot of all the cell cycle GO category genes from A. (C) Ingenuity Pathway Analysis (IPA) of all the cell cycle genes differentially expressed in 120 hpf uhrf1−/− liver RNA-Seq, pathways involved in cell cycle checkpoint regulation in bold, z- score in IPA indicates a predicted activation or inhibition of a pathway. (D) Genes from the G1/S checkpoint pathway generated by IPA plotted with log2fold change, important cell cycle genes highlighted in red. (E) qPCR on key cell cycle genes of 96 hpf uhrf1−/− and control livers. (F) qPCR on key cell cycle genes in the livers of P4 neonatal mice deficient for Uhrf1 in hepatocytes (Uhrf1HEPKO) and controls, inset shows band for Cre transgene by RT-PCR. (G) Heatmap of Log2 fold change of key cell cycle genes and Uhrf1 in individual P4 neonatal mice livers ranked by Uhrf1 expression levels. The number of clutches (zebrafish) or individual animals (mouse) are indicated for each condition and represented as median with range. P-value *< 0.05, **< 0.005, *** < 0.0005 by unpaired Student's t-test with adjustment for multiple comparisons. |
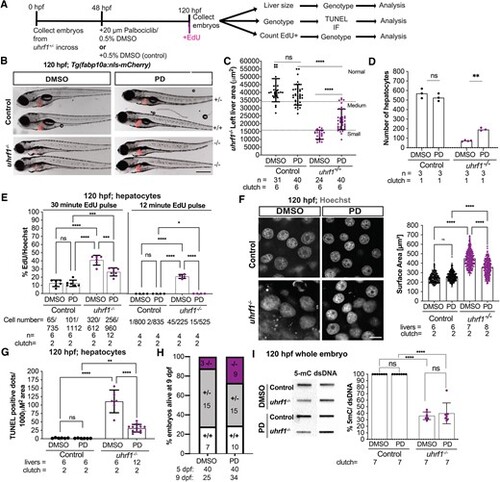
Cdk4/6 inhibition by Palbociclib (PD) rescues the uhrf1 mutant liver phenotype. (A) Treatment scheme for inhibitor Palbociclib (PD). (B) Representative images of 120 hpf uhrf1−/− and control embryos after DMSO or PD treatment, liver indicated in red. (C) Quantification of the left liver lobe area of 120 hpf PD treated and untreated livers, segregated based on the liver size. Normal, medium and small liver size ranges are defined based on mean of DMSO treated controls and mutants ±1 standard deviation, as shown by the error bars. (D) Quantification of the number of hepatocytes at 120 hpf uhrf1−/− and control embryos after DMSO or PD treatment based on Z-stack images of larvae with the hepatocyte nuclear marker, Tg(fabp10a:nls-mCherry). (E) Quantification of 30 min and 12 min EdU incorporation at 120 hpf in DMSO and PD treated controls and uhrf1−/−. (F) Representative confocal image of 120 hpf Hoechst stained control and uhrf1−/− hepatocytes from DMSO or PD treatment and quantification of the nuclear surface area. (G) TUNEL assay was performed to detect cell death in 120 hpf in DMSO and PD treated controls and uhrf1−/− and quantified. (H) Genotype of all larvae that survived at 9 dpf following treatment with vehicle or PD from 48–120 hpf. The number of larvae that were treated and the number that remained at 9 dpf are indicated below the graph. (I) Representative slot blot for 5-mC and double stranded (ds) DNA in 120 hpf uhrf1−/− whole embryos and sibling controls, with quantification of the methylation levels from seven clutches. Scale: 1000 μm in B, 50 μm in F, the number of samples and clutches indicated for each condition and represented as median with range. P-value *< 0.05, **< 0.005, *** < 0.0005 by unpaired Student's t-test with adjustment for multiple comparisons. |
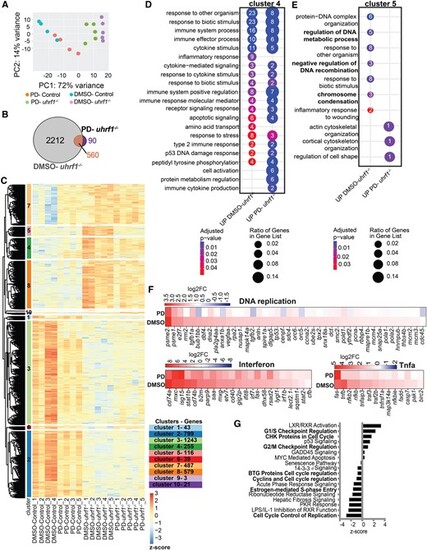
Cdk4/6 inhibition by Palbociclib (PD) rescues abnormal cell cycle gene expression in uhrf1 mutants. (A) PCA analysis of RNA Seq from 120 hpf Palbociclib (PD) treated and DMSO treated uhrf1−/− and control livers. (B) Venn diagram of differential expressed genes (DEGs) (cutoff P-adj < 0.05) between uhrf1−/− and their control siblings treated with DMSO and PD. (C) Unsupervised clustering heatmap of the expression profile of 120 hpf DMSO and PD treated uhrf1−/− liver. z-scores based on raw counts. Rows are divided into 10 clusters calculated on the hierarchical clustering of dendrogram (Euclidean distance). (D) REVIGO gene ontology of cluster 4 and (E) and cluster 5. (F) Key cell cycle genes, immune and tnfa response gene expression between PD and DMSO treated uhrf1−/− plotted as a heatmap with log2fold change. (G) IPA of the cell cycle genes differentially expressed between 120 hpf uhrf1−/− PD and DMSO livers, cell cycle checkpoint regulation pathways indicated in bold. P-value *< 0.05, **< 0.005, *** < 0.0005 by unpaired Student's t-test with adjustment for multiple comparisons and represented as median with range. |
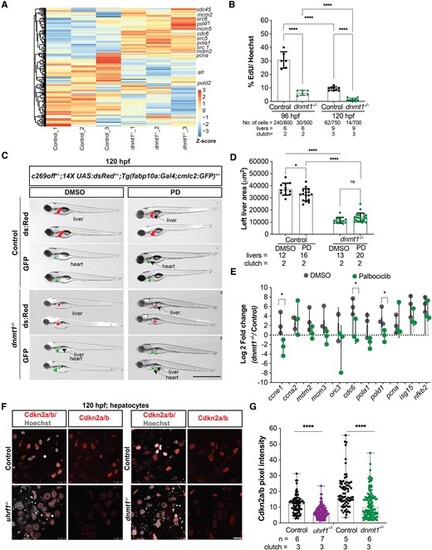
Cdkna2a/b depletion as a mechanism of Cdk4/6 activation in dnmt1 and uhrf1 mutants. (A) Unsupervised clustering heatmap of all the cell cycle genes of 120 hpf dnmt1−/− liver with z-scores based on rows, important S-phase genes are indicated. (B) EdU quantification (pulse 30 minute) of 96 hpf and 120 hpf control and dnmt1−/− hepatocytes. (C) Representative images of 120 hpf dnmt1−/− and controls with c269off+/−; 14X UAS:dsRed+/−; Tg(fabp10a:Gal4;cmlc2:GFP)+/− treated with DMSO or Palbociclib (PD), showing the liver (dsRed), the heart (GFP) as a marker of transgenesis and in green, the liver with hypomethylation in mutants only. (D) Quantification of the left liver lobe area of dnmt1−/− and controls, treated with PD or DMSO. Scale: 50 μm, the number of samples and clutches indicated for each condition. (E) QPCR of key cell cycle genes and immune genes in 120 hpf dnmt1−/− livers. (F) Representative immunofluorescent images of Cdkn2a/b in 120 hpf uhrf1−/−, dnmt1−/− and their respective control livers and (G) quantification of the Cdkn2a/b pixel intensity in hepatocytes. Scale: 1000 μm in C, 100 μm in F, the number of samples and clutches indicated for each condition. P-value *< 0.05, **< 0.005, *** < 0.0005 by unpaired Student's t-test with adjustment for multiple comparisons and represented as median with range. |
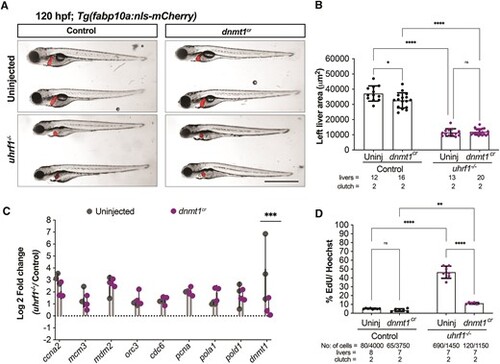
dnmt1 depletion rescues DNA replication defects in uhrf1 mutant hepatocytes. (A) Representative images of 120 hpf uhrf1−/− and control embryos uninjected or injected with dnmt1cr. (B) Quantification of the left liver lobe area of 120 hpf uhrf1−/− and controls uninjected or injected with dnmt1cr. (C) qPCR of key cell cycle genes in 120 hpf livers of uhrf1−/− and controls uninjected or injected with dnmt1cr. (D) 30 minute EdU incorporation at 120 hpf in uninjected and dnmt1cr injected controls and uhrf1−/− livers. Scale: 50 μm in B, 1000 μm in C, the number of samples and clutches indicated for each condition P-value *< 0.05, **< 0.005, *** < 0.0005 by unpaired Student's t-test with adjustment for multiple comparisons and represented as median with range |
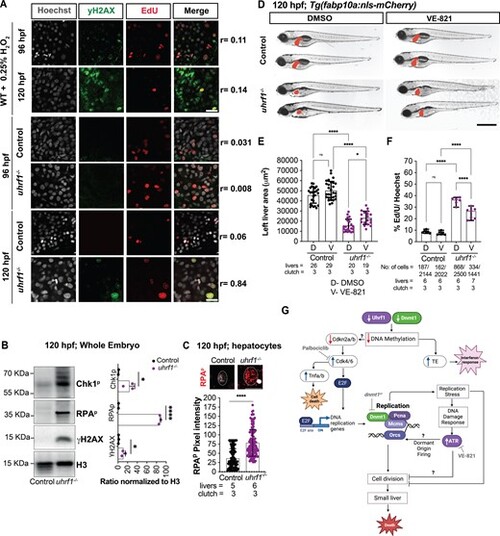
Atr inhibition increases liver size and decreases DNA replication in uhrf1 mutant hepatocytes. (A) Representative images of γH2AX immunofluorescence and EdU labeling at 96 hpf and 120 hpf embryos following H2O2 treatment as a positive control and of uhrf1−/− mutants and sibling control livers. r-values indicate Pearson's correlation of co-localized pixels from γH2AX and EdU fluorescence. (B) Western blot of whole embryo extracts from 120 hpf uhrf1−/− and control siblings for Chk1p, RPAP, γH2AX and H3 as a loading control. (C) Quantification of the RPAP pixel intensity in 120 hpf uhrf1−/− and their respective control hepatocytes. Insets show representative images of RPAP stained hepatocytes. (D) Representative images of 120 hpf uhrf1−/− and control larvae with Tg(fabp10a:nls-mCherry) after DMSO or VE- 821 treatment, liver highlighted in red. (E) Quantification of the left liver lobe area of 120 hpf VE- 821 treated and untreated embryos from uhrf1−/− and control larvae. (F) Quantification of EdU positive cells following 30 min of incorporation at 120 hpf in DMSO and VE- 821 treated control and uhrf1−/− livers. Scale: 50 μm in A, 100 μm in C, 1000 μm in D, the number of samples and clutches indicated for each condition. P-value *< 0.05, **< 0.005, *** < 0.0005 by unpaired Student's t-test with adjustment for multiple comparisons. Data represented as median with range. (G) Model of the relationship between uhrf1 mutation, DNA methylation, cell cycle regulation, DNA replication and hepatic outgrowth failure. Uhrf1 and Dnmt1 loss causes DNA hypomethylation, upregulation of TEs and inflammatory response. This also inhibits Cdkn2a/b at protein levels, causing Cdk4/6 activation, induction of DNA replication, replication stress, DNA damage and Atr mediated dormant origin firing. In a parallel pathway, Cdk4/6 also activates Tnfa and cell death. We speculate that the DNA damage response inhibits cell division, restricting organ outgrowth and causing lethality in uhrf1 mutants. |