
Fig. 5
- ID
- ZDB-FIG-240522-17
- Publication
- Madakashira et al., 2024 - DNA hypomethylation activates Cdk4/6 and Atr to induce DNA replication and cell cycle arrest to constrain liver outgrowth in zebrafish
- Other Figures
- All Figure Page
- Back to All Figure Page
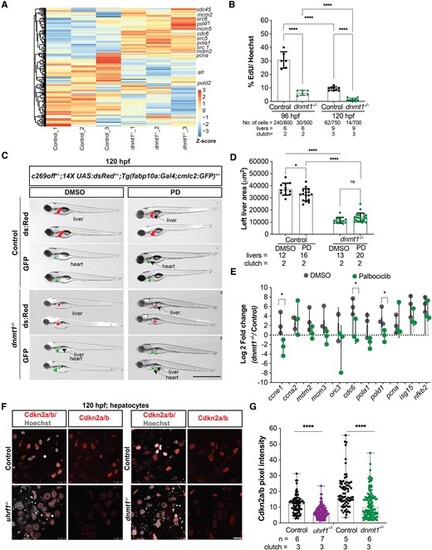
Cdkna2a/b depletion as a mechanism of Cdk4/6 activation in dnmt1 and uhrf1 mutants. (A) Unsupervised clustering heatmap of all the cell cycle genes of 120 hpf dnmt1−/− liver with z-scores based on rows, important S-phase genes are indicated. (B) EdU quantification (pulse 30 minute) of 96 hpf and 120 hpf control and dnmt1−/− hepatocytes. (C) Representative images of 120 hpf dnmt1−/− and controls with c269off+/−; 14X UAS:dsRed+/−; Tg(fabp10a:Gal4;cmlc2:GFP)+/− treated with DMSO or Palbociclib (PD), showing the liver (dsRed), the heart (GFP) as a marker of transgenesis and in green, the liver with hypomethylation in mutants only. (D) Quantification of the left liver lobe area of dnmt1−/− and controls, treated with PD or DMSO. Scale: 50 μm, the number of samples and clutches indicated for each condition. (E) QPCR of key cell cycle genes and immune genes in 120 hpf dnmt1−/− livers. (F) Representative immunofluorescent images of Cdkn2a/b in 120 hpf uhrf1−/−, dnmt1−/− and their respective control livers and (G) quantification of the Cdkn2a/b pixel intensity in hepatocytes. Scale: 1000 μm in C, 100 μm in F, the number of samples and clutches indicated for each condition. P-value *< 0.05, **< 0.005, *** < 0.0005 by unpaired Student's t-test with adjustment for multiple comparisons and represented as median with range. |