
|
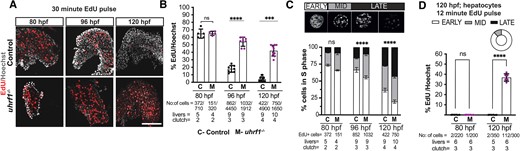
Fig. 1 uhrf1 mutant hepatocytes accumulate in late S-phase with increased DNA replication. (A) Representative Z-stack projection confocal images of EdU and Hoechst stained control and uhrf1−/− livers. Control and uhrf1−/− embryos were pulsed with EdU for 30 min at 80 hpf, 96 hpf and 120 hpf and processed for EdU fluorescence by Click-it. (B) Quantification of EdU incorporation in A. (C) 80 hpf, 96 hpf and 120 hpf hepatocytes were sorted into early, mid and late S phase based on EdU pattern and quantified. (D) Quantification of EdU incorporation from a 12 min EdU pulse at 80 hpf and 120 hpf control and uhrf1−/− hepatocytes. Pie chart represents percentage of hepatocytes in each stage of S phase. Scale bar = 50 μm, the number of samples and clutches indicated for each condition and represented as median with range. P-value *< 0.05, **< 0.005, *** < 0.0005 by unpaired Student's t-test with adjustment for multiple comparisons.