FIGURE SUMMARY
Title

Conservation of affinity rather than sequence underlies a dynamic evolution of the motif-mediated p53/MDM2 interaction in ray-finned fishes

Authors
Mihalič, F., Arcila, D., Pettersson, M.E., Farkhondehkish, P., Andersson, E., Andersson, L., Betancur-R, R., Jemth, P.
Source
Full text @ Mol Bio Evol

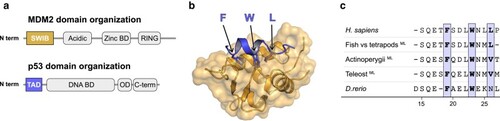
Structure of the human MDM2/p53TAD complex. a) Schematic domain architecture of MDM2 and p53. b) Crystal structure of the human complex between the SWIB domain of MDM2 (gold) and a peptide corresponding to the conserved binding motif in p53TAD (blue) (PDBid: 1ycr) (Kussie et al. 1996). Arrows highlight the conserved hydrophobic triad where the residues are shown as sticks. c) Sequence alignment of reconstructed and extant canonical MDM2-binding motifs of p53TAD. To facilitate comparison, the site numbering used here follows the human p53TAD-binding motif, from Ser15 to Pro27. The previously reconstructed maximum likelihood sequence for the most recent common ancestor of bony fishes and tetrapods (Mihalič et al. 2023) is indicated in the alignment as “fish versus tetrapods.”

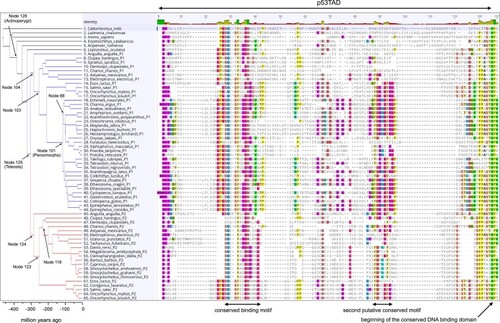
Sequence alignment of p53TAD mapped onto the fish phylogeny. We included 51 extant species representing some of the major lineages of fishes and for which high-quality sequencing data were available. The blue and red branches represent the split between the 2 paralogs p53TADP1 and p53TADP2, respectively, in teleosts (node 125). After the split, p53TADP1 and p53TADP2 have evolved in parallel in each lineage. Node numbers refer to the ancestral reconstruction analysis (supplementary Spreadsheet File S1, Supplementary Material online).

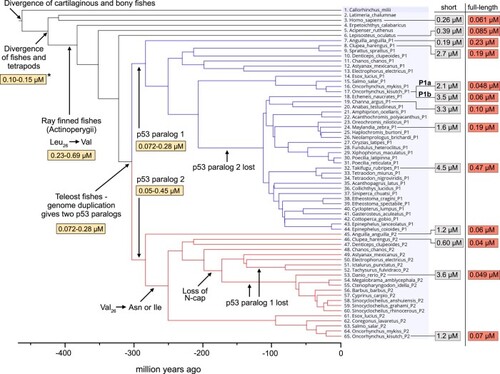
Affinities of p53TAD/MDM2 interactions. Affinities (KD values) of extant and ancient p53TAD15–27/MDM2 for different fishes mapped onto the phylogenetic tree. Key events that are discussed in the text are shown. Affinities for the reconstructed p53TAD15–27/MDM2 are highlighted in yellow, the affinities of p53TAD15–27/MDM2 for present-day fish species in gray and for the p53TADfull-length/MDM2 in red. See Table 1 and supplementary table S1, Supplementary Material online for errors. The affinity at the node representing the divergence of fishes and tetrapods, marked with a star, was determined previously (Mihalič et al. 2023).

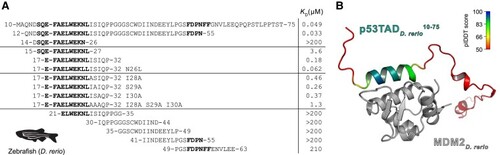
Affinities between p53TAD peptides and MDM2 from D. rerio. a) The overlapping peptides tiling a 51-residue stretch of p53TADD.rerio. To facilitate comparison, the numbering starts from the conserved motif and the residues of human p53TAD, F19xxxW23xxL26. With that in mind, the p53TAD10–75 in fact contains the whole TAD region of D. rerio and corresponds to p53TADfull-length. KD values for the peptide fragments were determined by the fluorescence polarization assay. Distal residues and Ile28Ser29Ile30 contribute to the affinity for MDM2. Both conserved motifs are in bold. The zebrafish silhouette was obtained from phylopic.org and is under CC0 1.0 DEED licence (https://creativecommons.org/publicdomain/zero/1.0/). b) ColabFold prediction of the interaction between D. rerio MDM2 and p53TAD10–75. The MDM2 is in gray, and the p53TAD10–75 is colored according to the pIDDT, where blue indicates highest and red lowest prediction confidence (pIDDT < 50).

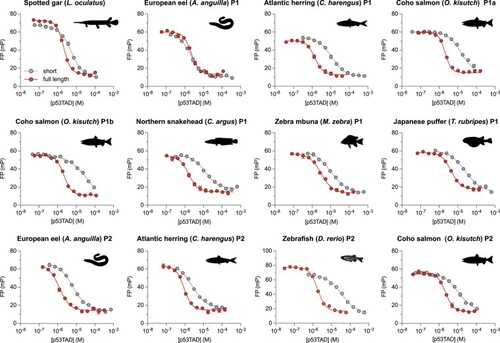
Affinity of short and full-length p53TAD of different extant fishes measured by fluorescence polarization competition experiments. Affinity is higher for full-length p53TAD constructs (Fig. 2; supplementary Spreadsheet S5, Supplementary Material online) as compared to the short p53TAD15–27, often by an order of magnitude, with the exception of A. anguilla p53TADP1. FP, fluorescence polarization in millipolarization units (mP). Animal silhouettes were obtained from phylopic.org and are under CC0 1.0 DEED licence (https://creativecommons.org/publicdomain/zero/1.0/).

Acknowledgments
This image is the copyrighted work of the attributed author or publisher, and ZFIN has permission only to display this image to its users. Additional permissions should be obtained from the applicable author or publisher of the image. Full text @ Mol Bio Evol