IMAGE

Fig. 3.

ID
ZDB-IMAGE-240229-121
Source
Figures for Mihalič et al., 2024
Image
Figure Caption

Fig. 3.

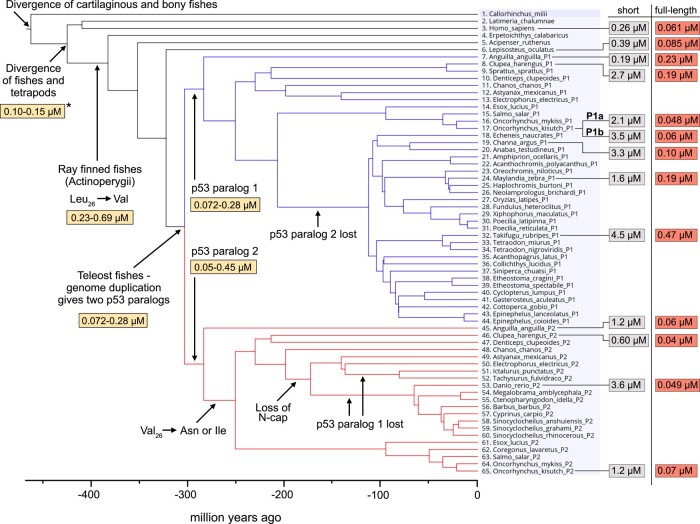
Affinities of p53TAD/MDM2 interactions. Affinities (KD values) of extant and ancient p53TAD15–27/MDM2 for different fishes mapped onto the phylogenetic tree. Key events that are discussed in the text are shown. Affinities for the reconstructed p53TAD15–27/MDM2 are highlighted in yellow, the affinities of p53TAD15–27/MDM2 for present-day fish species in gray and for the p53TADfull-length/MDM2 in red. See Table 1 and supplementary table S1, Supplementary Material online for errors. The affinity at the node representing the divergence of fishes and tetrapods, marked with a star, was determined previously (Mihalič et al. 2023).

Acknowledgments
This image is the copyrighted work of the attributed author or publisher, and ZFIN has permission only to display this image to its users. Additional permissions should be obtained from the applicable author or publisher of the image. Full text @ Mol Bio Evol