
- Title
-
Hox genes control homocercal caudal fin development and evolution
- Authors
- Cumplido, N., Arratia, G., Desvignes, T., Muñoz-Sánchez, S., Postlethwait, J.H., Allende, M.L.
- Source
- Full text @ Sci Adv
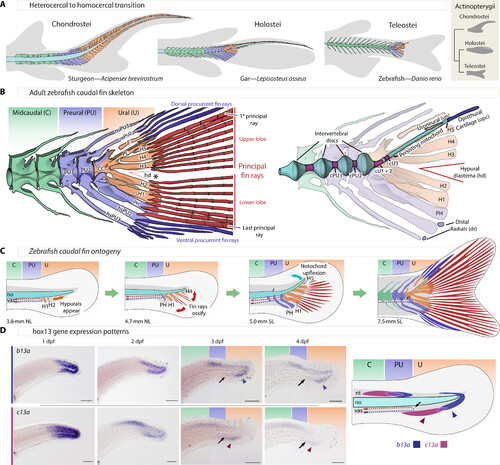
Zebrafish caudal anatomy, development, evolution, and b13a and c13a expression. (A) Representative caudal fin morphologies in actinopterygians, featuring gray-shaded body contour and fin rays, with midcaudal, preural, and ural elements in green, blue, and orange, respectively. (B) Left: Adult zebrafish caudal fin skeleton, highlighting the three regions of the caudal fin and the separation of upper and lower principal rays (asterisk, *). Right: Description of internal elements within the caudal fin skeleton, including the notochord. (C) Developmental relocation of the zebrafish caudal fin elements following bending of the notochord and the appearance of principal fin rays. (D) In situ hybridizations showing b13a and c13a transcripts from 1 to 4 days postfertilization (dpf) and schematic representation of expression domains of both genes at 4 dpf. Black arrows indicate the end of the caudal artery at the PU-U boundary, while blue and red arrowheads mark the ventral expression domains of b13a and c13a, respectively. Scale bars, 0.1 mm. CC, compound centrum; cPU2 and cPU3, preural chordacentra 2 and 3; cU1 to cU3, ural chordacentra 1 to 3; dr, distal radial; E, epural; H1 to H5, hypurals 1 to 5; hd, hypural diastema; hsPU2 and hsPU3, haemal spines of the preural centra 2 and 3; nsPU2 and sPU3, neural spines of the preural centra 2 and 3; NL, notochordal length; no, notochord; opc, opisthural cartilage; PH, parhypural; PL, pleurostyle; PU2 and PU3, preural centra 2 and 3; SL, standard length; un, uroneural; vas, vasculature. |
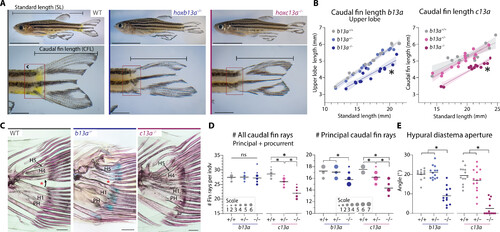
Caudal fin phenotypes in b13a and c13a zebrafish mutants. (A) Lateral views of WT and homozygous b13a and c13a mutants (10 mm scale bar for whole fish; 2 mm for caudal fin close-up). (B) Upper lobe length relative to SL in WT, heterozygous, and homozygous mutant siblings (n = b13a+/+:14, b13a+/−:14, b13a−/−:14, c13a+/+:13, c13a+/−:14, and c13a−/−:12). Analysis of covariance indicated a significant reduction in upper lobe length in both homozygous mutants [b13a: F2,38 = 88.0, P < 0.0001; c13a: F2,35 = 59.86, P < 0.0001]. Shaded area represents the 95% confidence interval around the regression line. (C) Skeletal staining showing caudal ray bases, hypurals, and the hypural diastema (red asterisk). Scale bars, 200 μm. (D) Caudal and principal ray number in both mutants (n = b13a+/+:12, b13a+/−:14, b13a−/−:14, c13a+/+:13, c13a+/−:15, and c13a−/−:12). Analysis of variance (ANOVA) revealed a significant reduction in total fin ray number for c13a [F2,37 = 67.02, P < 0.0001], but not for b13a mutants [F2,37 = 0.2223, P = 0.8017]. Multiple comparisons indicated a c13a gene-dosage effect (P < 0.0001 for all comparisons). Both mutants reduced principal ray number [b13a: F2,37 = 10,11, P = 0.0003; c13a: F2,37 = 36.93, P < 0.0001] with only b13a−/− differing from its siblings [P = 0.0021 versus b13a+/− and P = 0.0008 versus b13a+/+], while c13a demonstrating the same gene-dosage effect (P < 0.0001 for all comparisons). (E) Hypural diastema aperture angle in both mutants (n = b13a+/+:12, b13a+/−:14, b13a−/−:14, c13a+/+:13, c13a+/−:14, and c13a−/−:12). ANOVA revealed a significant reduction in diastema aperture for both genes [b13a: F2,33 = 39.89, P < 0.0001; c13a: F2,36 = 42.28, P < 0.0001]. Multiple comparisons showed this effect in homozygous mutants only (P < 0.0001 for b13a−/− and c13a−/−). For (D) and (E), horizontal lines represent the mean; circle size is proportional to fish scored. See Fig. 1 for anatomical terminology. PHENOTYPE:
|
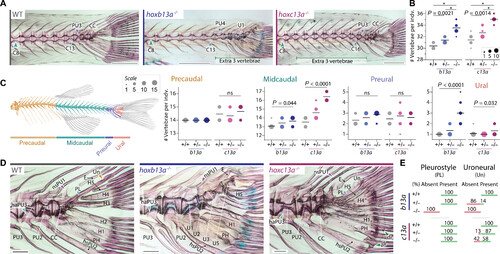
Vertebral phenotypes of b13a and c13a zebrafish mutants. (A) Cleared and stained skeletal preparations of WT and homozygous b13a and c13a mutants showing variation in tail vertebrae number. Scale bars, 1 mm. For (B), (C), and (E), n = b13a+/+:12, b13a+/−:14, b13a−/−:14, c13a+/+:13, c13a+/−:15, and c13a−/−:12. (B) Total number of vertebrae in both mutants. ANOVA revealed a significant increase in vertebrae number [b13a: F2,37 = 78.28, P < 0.0001; c13a: F2,37 = 63.49, P < 0.0001] and multiple comparisons showed a gene-dosage effect for both genes (*P < 0.0001). (C) Vertebral number per body region in both mutants. Poisson regressions revealed significant increases for both mutants in midcaudal [b13a: χ2(2) = 6.23, P = 0.044; c13a: χ2(2) = 30.003, P < 0.0001] and ural vertebrae [b13a: χ2(2) = 41.22, P < 0.0001; c13a: χ2(2) = 6.88, P = 0.032]. Other comparisons were not significant (ns) [precaudal | c13a: χ2(2) = 1.54, P = 0.46; preural | b13a: χ2(2) = 3.08, P = 0.21; preural | c13a: χ2(2) = 0.32, P = 0.85). Post hoc tests were not applied due to the minimal variance or absence of variance in several observations, rendering those tests invalid. The line is at the mean and circle size is proportional to the number of individuals. (D) Caudal fin endoskeleton of WT and homozygous b13a and c13a mutants. The pleurostyle (blue arrowhead) and uroneural (orange arrowhead) are absent in b13a−/− mutants. An elongated neural spine of the preural centrum 1 (purple arrowhead) is present in both mutants. Extra distal radials (green arrowheads) are present in c13a−/− mutants. A cartilaginous articulation of the haemal arch of the preural centrum 3 with its centrum (light blue arrowhead) is present in the b13a−/− mutant, as revealed by Alcian blue staining. Scale bars, 200 μm. (E) Frequencies of pleurostyle and uroneural loss in b13a and c13a mutants. See Fig. 1 for anatomical terminology. PHENOTYPE:
|

Length and somite number in mutant b13a−/− and c13a−/− larvae. (A) NL of 3-dpf WT, b13a−/−, and c13a−/− mutant larvae. n = WT:7, b13a−/−:5, and c13a−/−:6. ANOVA revealed a significant change in larval length [F2,15 = 18.59, P < 0.0001]. Multiple comparisons indicated significantly longer b13a (P < 0.0001) and c13a (P = 0.0011) larvae compared with WTs. Scale bars, 0.5 mm. (B) Tail somite number in 2-dpf WT, b13a−/−, and c13a−/− mutant larvae, using in situ hybridization with the myotome boundary marker xirp2a. (n = WT:8, b13a−/−:11, and c13a−/−:10). Poisson regression revealed significant increases in somite number for both mutants [χ2(2) = 33.19, P < 0.0001]. Post hoc tests were not applied due to the absence of variance in WTs, rendering those tests invalid. Circle size is proportional to fish scored (0.5 mm scale bar for WT, 0.2 mm scale bars for b13a−/− and c13a−/− mutants). (C) In situ hybridization against hoxc12a in 2-dpf WT and c13a−/− mutant embryos. Scale bars, 0.2 mm. For (A) and (B), graph horizontal lines represent the mean. PHENOTYPE:
|

Ontogenetic series of cleared and stained skeletal preparations for b13a−/− and c13a−/− mutants. The figure displays the development of the caudal fin in zebrafish WT, b13a−/−, and c13a−/− mutants, focusing on the formation of fin rays and posterior vertebrae. (A) 5.03-mm NL WT specimen. (B) 5.93-mm SL WT specimen. (C) 7.40-mm SL WT specimen. (D) Diagram showing normal zebrafish caudal fin development, fin ray appearance is aligned with the hypural diastema. (E) 5.38-mm NL b13a−/− mutant specimen. (F) 6.22-mm SL b13a−/− mutant specimen. (G) 8.71-mm SL b13a−/− mutant specimen. (H) Diagram showing the b13a−/− mutant caudal fin development, with a reduced hypural diastema and the appearance of fin rays not aligned with the position of the diastema. The notochord is abbreviated, with no opisthural cartilage, the base of hypurals is closer to the notochord posterior end, and an additional preural element is present anteriorly. (I) 5.58-mm NL c13a−/− mutant specimen. (J) 6.26-mm SL c13a−/− mutant specimen. (K) 8.16-mm SL c13a−/− mutant specimen. Black arrowheads, extra distal radials. (L) Diagram showing the c13a−/− mutant caudal fin development, lacking a hypural diastema, with fewer fin rays forming, more spaced between them, and additional radials at the distal ends of the hypurals 1 and 2. Red arrowheads, extra cartilaginous haemal arch or spine; yellow arrowheads, first neural arch/spine that develops; black asterisk, separation between upper and lower caudal fin lobes. See Fig. 1 for anatomical terminology. Scale bars, 0.1 mm. PHENOTYPE:
|
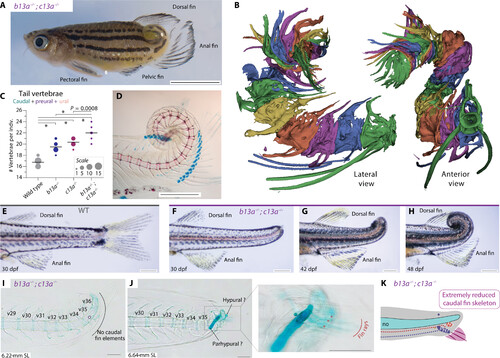
b13a−/−; c13a−/− double mutants have coiled tails that lack a caudal fin. (A) Adult double mutant zebrafish showing a coiled tail and posterior repositioning of the anal fin. Scale bar, 5 mm. (B) Segmented micro-CT images of the double mutant tail with each vertebra colored differently. The posterior vertebrae are abbreviated and highly fused. (C) Tail vertebral number in double mutants, single mutants, and WTs. ANOVA revealed a significant increase in tail vertebrae [F3,53 = 101.91, P < 0.0001]. Multiple comparisons indicated that, except for the b13a-c13a pair, all comparisons were statistically significant, indicating that both genes act additively contributing to tail vertebrae number. *P < 0.0001. The line indicates the mean and circle size is proportional to the number of individuals. (D) Cleared and stained skeletal preparation of an adult double mutant tail, revealing a spiral tail without caudal fin rays at the tip. Scale bar, 1 mm. (E) Lateral view of a WT tail. (F to H) Ontogenetic sequence of tail transformations in b13a−/−; c13a−/− double mutants. Scale bars, 1 mm. (I) A cleared and stained skeletal preparation of 6.22-mm NL double mutant larva reveals the absence of any cartilaginous or bony element unique to the caudal fin, including no hypural or fin rays. (J) 6.64-mm NL double mutant larva shows two cartilaginous elements and three rudimentary fin rays. (K) Diagram of the same specimen depicting the presence of few fin rays and abbreviated caudal fin, consisting of a single hypural and a single preural element. Scale bars, 0.1 mm [(I) to (K)]. For anatomical terminology, see Fig. 1. PHENOTYPE:
|
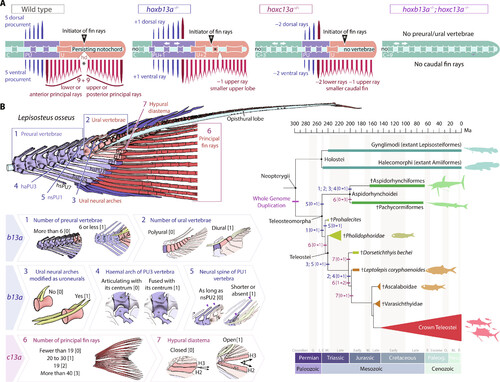
b13a−/− and c13a−/− zebrafish mutants recapitulate the heterocercal-to-homocercal transition. (A) Linearized diagram illustrating the phenotypic differences in a single and double b13a−/− and c13a−/− mutants compared to a WT tail. White arrows indicate expanded body regions. “Initiator of fin rays” indicates the position where caudal rays appear during ontogeny. The black asterisk represents the separation between upper and lower lobe caudal fin ray clusters. (B) Diagram of the caudal fin skeleton of the longnose gar Lepisosteus osseus, highlighting the main morphological characters reversed in b13a−/− and c13a−/− mutants (numbered from 1 to 7). States of the seven characters numbered from [0] to [3]. These characters are mapped on a simplified phylogeny of stem teleosts (44–46), with Holostei as an outgroup. Most characters experienced high homoplasy and underwent modifications during the evolution of basal teleosts in the Triassic during the heterocercal-to-homocercal transition. See Fig. 1 for anatomical terminology. |

ZFIN is incorporating published figure images and captions as part of an ongoing project. Figures from some publications have not yet been curated, or are not available for display because of copyright restrictions. |
|
ZFIN is incorporating published figure images and captions as part of an ongoing project. Figures from some publications have not yet been curated, or are not available for display because of copyright restrictions. EXPRESSION / LABELING:
|
|
ZFIN is incorporating published figure images and captions as part of an ongoing project. Figures from some publications have not yet been curated, or are not available for display because of copyright restrictions. PHENOTYPE:
|
|
ZFIN is incorporating published figure images and captions as part of an ongoing project. Figures from some publications have not yet been curated, or are not available for display because of copyright restrictions. PHENOTYPE:
|
|
ZFIN is incorporating published figure images and captions as part of an ongoing project. Figures from some publications have not yet been curated, or are not available for display because of copyright restrictions. |
|
ZFIN is incorporating published figure images and captions as part of an ongoing project. Figures from some publications have not yet been curated, or are not available for display because of copyright restrictions. PHENOTYPE:
|