
Fig. 2
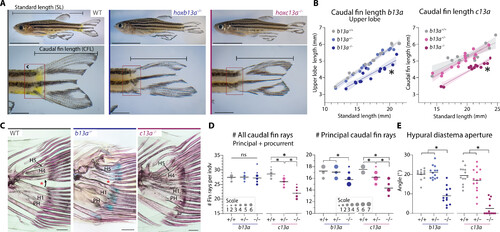
Caudal fin phenotypes in b13a and c13a zebrafish mutants. (A) Lateral views of WT and homozygous b13a and c13a mutants (10 mm scale bar for whole fish; 2 mm for caudal fin close-up). (B) Upper lobe length relative to SL in WT, heterozygous, and homozygous mutant siblings (n = b13a+/+:14, b13a+/−:14, b13a−/−:14, c13a+/+:13, c13a+/−:14, and c13a−/−:12). Analysis of covariance indicated a significant reduction in upper lobe length in both homozygous mutants [b13a: F2,38 = 88.0, P < 0.0001; c13a: F2,35 = 59.86, P < 0.0001]. Shaded area represents the 95% confidence interval around the regression line. (C) Skeletal staining showing caudal ray bases, hypurals, and the hypural diastema (red asterisk). Scale bars, 200 μm. (D) Caudal and principal ray number in both mutants (n = b13a+/+:12, b13a+/−:14, b13a−/−:14, c13a+/+:13, c13a+/−:15, and c13a−/−:12). Analysis of variance (ANOVA) revealed a significant reduction in total fin ray number for c13a [F2,37 = 67.02, P < 0.0001], but not for b13a mutants [F2,37 = 0.2223, P = 0.8017]. Multiple comparisons indicated a c13a gene-dosage effect (P < 0.0001 for all comparisons). Both mutants reduced principal ray number [b13a: F2,37 = 10,11, P = 0.0003; c13a: F2,37 = 36.93, P < 0.0001] with only b13a−/− differing from its siblings [P = 0.0021 versus b13a+/− and P = 0.0008 versus b13a+/+], while c13a demonstrating the same gene-dosage effect (P < 0.0001 for all comparisons). (E) Hypural diastema aperture angle in both mutants (n = b13a+/+:12, b13a+/−:14, b13a−/−:14, c13a+/+:13, c13a+/−:14, and c13a−/−:12). ANOVA revealed a significant reduction in diastema aperture for both genes [b13a: F2,33 = 39.89, P < 0.0001; c13a: F2,36 = 42.28, P < 0.0001]. Multiple comparisons showed this effect in homozygous mutants only (P < 0.0001 for b13a−/− and c13a−/−). For (D) and (E), horizontal lines represent the mean; circle size is proportional to fish scored. See Fig. 1 for anatomical terminology. |