
- Title
-
Astaxanthin activates the Nrf2/Keap1/HO-1 pathway to inhibit oxidative stress and ferroptosis, reducing triphenyl phosphate (TPhP)-induced neurodevelopmental toxicity
- Authors
- Zhang, Q., Luo, C., Li, Z., Huang, W., Zheng, S., Liu, C., Shi, X., Ma, Y., Ni, Q., Tan, W., Peng, J., Chen, Y., Wu, W., Li, J., Wu, K.
- Source
- Full text @ Ecotoxicol. Environ. Saf.

Developmental toxicity and neurological abnormalities were observed in embryonic zebrafish exposed to TPhP. (A-D) Effects of TPhP exposure on AchE, DA, ATPase and GST levels in zebrafish larvae at 96 hpf. (E) Expression analysis of genes along the nervous system. (F) Expression analysis of genes related to neurodevelopment. The treatment groups were composed of three replicates, each containing 25 larvae. (G) Tg (elav13/huc: EGFP) transgenic zebrafish with green fluorescence were used to mark axons of Purkinje neurons. (H-J) Each group exposed to TPhP showed the green fluorescence of transgenic Tg (sox10: EGFP) zebrafish (72 hpf, 96 hpf and 7 dpf) that marked neural crest origin cells. Values represent mean ± SEM. In comparison with the control group, * p < 0.05, * * p < 0.01 (one-way ANOVA and LSD test was employed). |
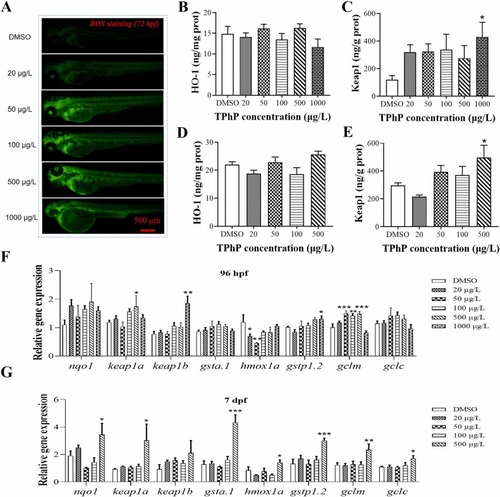
TPhP induced oxidative stress and activated Nrf2/Keap1/HO-1 signaling pathway in zebrafish larval. (A) ROS production induced by TPhP in zebrafish at 72 hpf. (B-C) The expression of HO-1 and Keap1 of zebrafish (96 hpf) exposed to TPhP. (D-E) The expression of HO-1 and Keap1 of zebrafish (7 dpf) exposed to TPhP. (F-G) The transcriptional expression of related genes in the Keap1/Nrf2 pathway of zebrafish (96 hpf and 7 dpf) exposed to TPhP. The treatment groups were composed of three replicates, each containing 25 larvae. Values represent mean ± SEM. In comparison with the control group, * p < 0.05, * * p < 0.01, * ** p < 0.001 (one-way ANOVA and LSD test was employed). |
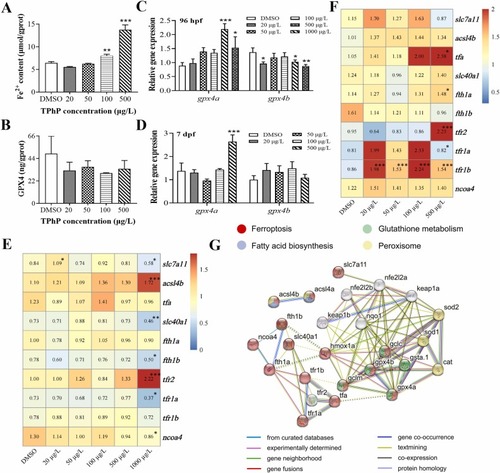
A gradient concentration of TPhP induced ferroptosis in embryonic zebrafish. (A) Fe2+ content in zebrafish. (B) The levels of GPX4 of zebrafish (7 dpf) in each TPhP group. (C-D) The expressions of gpx4a and gpx4b in zebrafish at 96 hpf and 7 dpf in each TPhP groups. (E-F) The heatmap of ferroptosis-related genes in zebrafish at 96 hpf (E) and 7 dpf (F). (G) Protein interaction network analysis (PPI) was used to determine the correlations among the molecules involved in this study. The treatment groups were composed of three replicates, n = 25 larvae. Values represent mean ± SEM. In comparison with the control group, * p < 0.05, * * p < 0.01, * ** p < 0.001 (one-way ANOVA and LSD test was employed). |
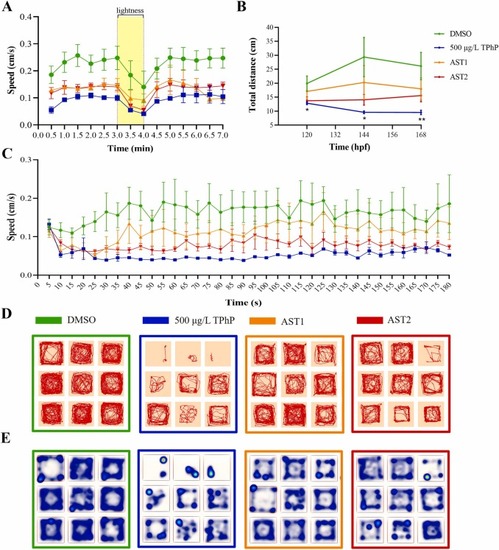
Astaxanthin (AST) can partially rescue the neurobehavioral disorders induced by TPhP. (A) The velocity of zebrafish larvae (at 6 dpf) was recorded in the DMSO, TPhP (500 μg/L), AST1: TPhP (500 μg/L) + AST (30 nM) and AST2: TPhP (500 μg/L) + AST (100 nM) groups, respectively (Model A). (B) The total distance traveled was calculated in each group (Model B). (C) The velocity of zebrafish larvae (at 6 dpf) was recorded in each group (Model B). (D) The tracking paths of zebrafish from each experimental group were shown in the figure. (E) A heatmap showing the path followed by nine zebrafish from each experimental group. The blue marks indicate the area the zebrafish passed through, and the depth of color represents cumulative frequency. Values represent mean ± SEM. In comparison with the control group, * p < 0.05, * * p < 0.01 (one-way ANOVA and LSD test was employed). |
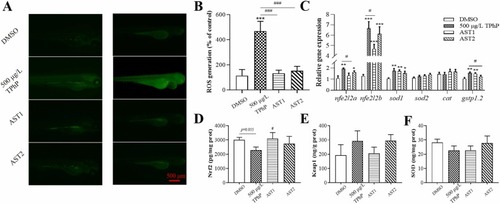
The level/activity of oxidative stress biomarkers affected by TPhP can be partially rescued by astaxanthin (AST). (A) The ROS production and apoptotic signals were measured in TPhP and astaxanthin + TPhP-treated zebrafish embryos. (B) Quantitative analysis of ROS generation. (C) The expression of oxidative stress-related genes in zebrafish after 96 hpf exposure to each group. (D-F) The levels of Nrf2, Keap1 and SOD of zebrafish exposed to each group for 96 hpf. AST1 is the abbreviation for TPhP (500 μg/L) + AST (30 nM) and AST2 is the abbreviation for TPhP (500 μg/L) + AST (100 nM). The treatment groups were composed of three replicates, each containing 25 larvae. Values represent mean ± SEM. In comparison with the control group, * p < 0.05, * * p < 0.01, * ** p < 0.001. Compared with 500 μg/L group, # p < 0.05, ### p < 0.001 (one-way ANOVA and LSD test was employed). |

Astaxanthin treatment can partially prevent ferroptosis in zebrafish induced by TPhP. (A) Fe2+ content in zebrafish larvae was measured in control, 500 μg/L TPhP, and AST + TPhP-treated zebrafish embryos at 96 hpf. (B) The levels of GPX4 of zebrafish exposed to each group for 7 dpf. (C) The expressions of gpx4a and gpx4b in zebrafish after 96 hpf exposure to TPhP. (D) The change of ferroptosis-related genes in zebrafish at 7 dpf. (E-J) Representative western blotting results (E) and quantification (F-J) showing the expression of Casepase3, Casepase9, BAX, BCL2 and SLC7A11 in control, 500 μg/L TPhP, and AST + TPhP-treated zebrafish embryos at 96 hpf. AST1 is the abbreviation for TPhP (500 μg/L) + AST (30 nM) and AST2 is the abbreviation for TPhP (500 μg/L)+ AST (100 nM). The treatment groups were composed of three replicates, n = 25/50 larvae. Values represent mean ± SEM. In comparison with the control group, * p < 0.05, * * p < 0.01, * ** p < 0.001. Compared with 500 μg/L TPhP group, # p < 0.05, ## p < 0.01, ### p < 0.001 (one-way ANOVA and LSD test was employed). |