
|
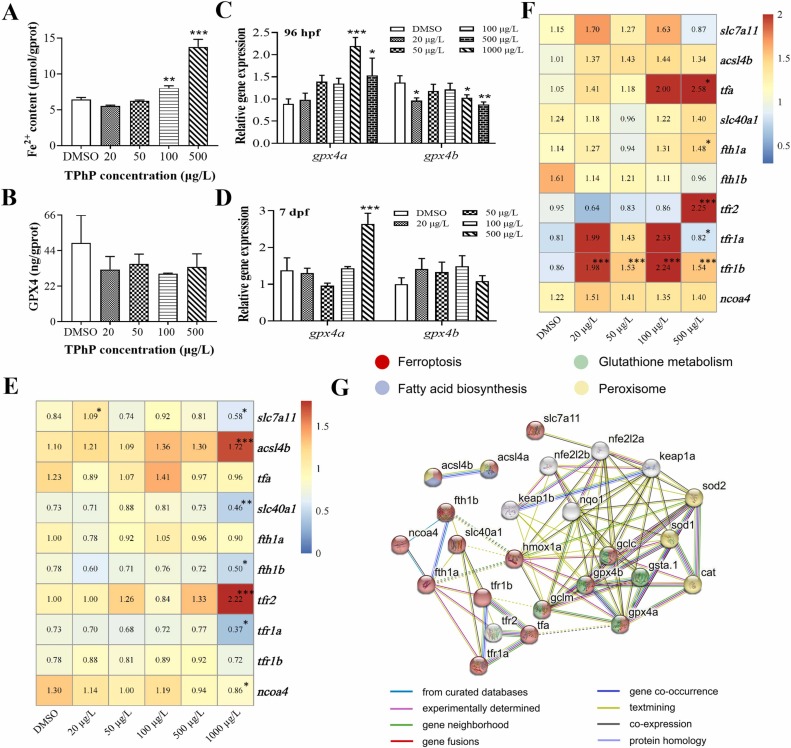
Fig. 3 A gradient concentration of TPhP induced ferroptosis in embryonic zebrafish. (A) Fe2+ content in zebrafish. (B) The levels of GPX4 of zebrafish (7 dpf) in each TPhP group. (C-D) The expressions of gpx4a and gpx4b in zebrafish at 96 hpf and 7 dpf in each TPhP groups. (E-F) The heatmap of ferroptosis-related genes in zebrafish at 96 hpf (E) and 7 dpf (F). (G) Protein interaction network analysis (PPI) was used to determine the correlations among the molecules involved in this study. The treatment groups were composed of three replicates, n = 25 larvae. Values represent mean ± SEM. In comparison with the control group, * p < 0.05, * * p < 0.01, * ** p < 0.001 (one-way ANOVA and LSD test was employed).