
- Title
-
Estrogen-dependent expression and function of secretogranin 2a in female-specific peptidergic neurons
- Authors
- Fleming, T., Tachizawa, M., Nishiike, Y., Koiwa, A., Homan, Y., Okubo, K.
- Source
- Full text @ PNAS Nexus

FeSP neurons express scg2a dependent on ovarian estrogen. A) Integrative genomics viewer image of RNA-seq reads from FeSP neurons in the PMm/PMg of intact, sham-operated (sham), and ovariectomized (OVX) females (n = 3 for each treatment) for XLOC_005021 (scg2a). B) Phylogenetic tree showing the relationship of medaka Scg2a to other known granins. The number at each node indicates bootstrap values for 1,000 replicates. Scale bar represents 0.1 substitutions per site. For species names and GenBank accession numbers, see Table S2. CHGA, chromogranin A; CHGB, chromogranin B. C) Levels of scg2a expression in FeSP neurons of females that were sham-operated (sham) or ovariectomized and treated with vehicle only (OVX), estradiol-17β (OVX + E2), or 11-ketotestosterone (OVX + KT) as determined by real-time PCR (n = 6 for all groups except OVX + KT, where n = 5). Mean value of the sham group was arbitrarily set to 1. D and E) Representative micrographs showing the expression of scg2a in FeSP neurons (expressing npba) (D) and it- and vt-expressing neurons (E) in the PMm/PMg. Left and middle panels show images of scg2a (magenta) and npba/it/vt (green) expression, respectively, in the same section; right panels show the merged images with nuclear counterstaining (blue). Arrowheads indicate representative neurons coexpressing scg2a and npba/it/vt. Scale bars represent 50 μm. Statistical differences were assessed by Bonferroni's post hoc test (C). **P < 0.01; ***P < 0.001. |
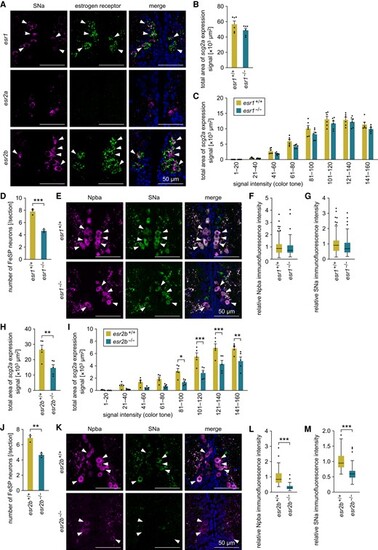
The expression of scg2a in FeSP neurons is mediated by Esr2b. A) Representative micrographs showing the expression of estrogen receptors in Scg2a-expressing neurons in the PMm/PMg. Left and middle panels show images of SNa immunofluorescence (magenta) and estrogen receptor (esr1/esr2a/esr2b) transcript (green), respectively, in the same section; right panels show the merged images with nuclear counterstaining (blue). Arrowheads indicate representative Scg2a-expressing neurons that coexpress the indicated estrogen receptor. B) Total area of scg2a expression signal in the PMm/PMg of esr1+/+ and esr1−/− females (n = 6 for each genotype). C) Area of scg2a expression signal at different intensities in the PMm/PMg of esr1+/+ and esr1−/− females (n = 6 for each genotype). The x-axis indicates the signal intensity, with smaller numbers representing stronger intensity. D) Number of FeSP neurons per coronal section of the PMm/PMg of esr1+/+ and esr1−/− females (n = 3 for each genotype). E) Representative micrographs showing Npba (left panels; magenta) and SNa (middle panels; green) immunofluorescence in FeSP neurons (arrowheads) of esr1+/+ and esr1−/− females. Right panels show the merged images with nuclear counterstaining (blue). F, G) Relative intensity of Npba (F) and SNa (G) immunofluorescence in FeSP neurons of esr1+/+ (n = 94 neurons) and esr1−/− (n = 70 neurons) females. Mean intensity in esr1+/+ FeSP neurons was arbitrarily set to 1. H) Total area of scg2a expression signal in the PMm/PMg of esr2b+/+ and esr2b−/− females (n = 5 for each genotype). I) Area of scg2a expression signal at different intensities in the PMm/PMg of esr2b+/+ and esr2b−/− females (n = 5 for each genotype). The x-axis indicates the signal intensity, with smaller numbers representing stronger intensity. J) Number of FeSP neurons per coronal section of the PMm/PMg of esr2b+/+ and esr2b−/− females (n = 3 for each genotype). K) Representative micrographs showing Npba (left panels; magenta) and SNa (middle panels; green) immunofluorescence in FeSP neurons (arrowheads) of esr2b+/+ and esr2b−/− females. Right panels show the merged images with nuclear counterstaining (blue). L, M) Relative intensity of Npba (L) and SNa (M) immunofluorescence in FeSP neurons of esr2b+/+ (n = 70 neurons) and esr2b−/− (n = 72 neurons) females. Mean intensity in esr2b+/+ FeSP neurons was arbitrarily set to 1. Scale bars in all panels represent 50 μm. Statistical differences were assessed by unpaired t-test (B, D, F–H, J, M), unpaired t-test with Bonferroni–Dunn correction (C, I), and unpaired t-test with Welch's correction (L). *P < 0.05; **P < 0.01; ***P < 0.001. |
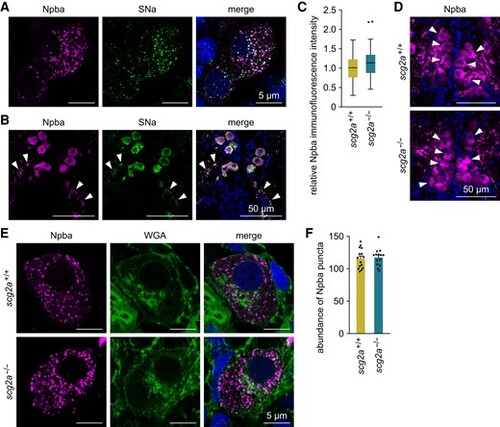
Scg2a is not involved in neuropeptide packaging to secretory granules in FeSP neurons. A) Representative micrographs showing the distribution and colocalization of Npba and SNa polypeptides in FeSP neurons of wild-type females. Left and middle panels show images of Npba (magenta) and SNa (green) immunofluorescence, respectively, in the same section; right panel shows the merged image with nuclear counterstaining (blue). Scale bars represent 5 μm. B) Representative micrographs showing Npba (left panel; magenta) and SNa (middle panel; green) immunofluorescence in the axons of FeSP neurons (arrowheads). Right panel shows the merged image with nuclear counterstaining (blue). Scale bars represent 50 μm. C) Relative intensity of Npba immunofluorescence in FeSP neurons of scg2a+/+ (n = 87 neurons) and scg2a−/− (n = 80 neurons) females. Mean intensity in scg2a+/+ FeSP neurons was arbitrarily set to 1. D) Representative micrographs showing Npba immunofluorescence (magenta) in FeSP neurons (arrowheads) of scg2a+/+ and scg2a−/− females. Cell nuclei are shown in blue. Scale bars represent 50 μm. E) Representative micrographs showing the distribution of Npba puncta (left panels; magenta) in scg2a+/+ and scg2a−/− FeSP neurons, counterstained with WGA (middle panels; green). Right panels show merged images with nuclear counterstaining (blue). Scale bars represent 5 μm. F) Abundance of Npba puncta in FeSP neurons of scg2a+/+ (n = 15 neurons) and scg2a−/− (n = 14 neurons) females. Data in panels C–F were obtained from the Δ14 knockout line. Statistical differences were assessed by unpaired t-test (C, F) |
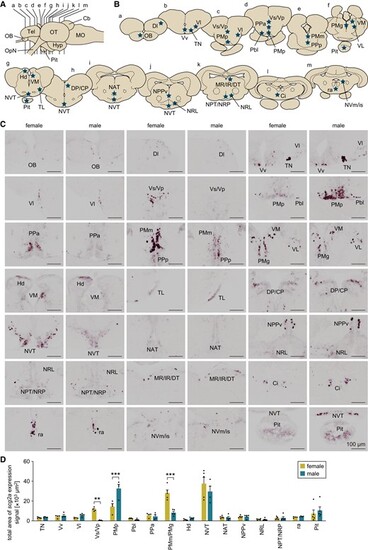
scg2a shows region-specific sex differences in expression in the medaka brain. A) Lateral view (anterior to the left) of the medaka brain showing the approximate levels of coronal sections presented in panel B. Cb, cerebellum; Hyp, hypothalamus; MO, medulla oblongata; OB, olfactory bulb; OpN, optic nerve; OT, optic tectum; Pit, pituitary; Tel, telencephalon. B) Coronal sections showing the location of brain nuclei in which scg2a is expressed (stars). C) Representative micrographs depicting the expression of scg2a in the respective brain nuclei and pituitary of females and males. Scale bars represent 100 µm. For abbreviations of brain nuclei, see Table S1. D) Total area of scg2a expression signal in the respective brain nuclei and pituitary of females and males (n = 5 per sex). In brain nuclei other than these, signal was scarce and/or weak and could not be reliably quantitated. Statistical differences were assessed by unpaired t-test with Bonferroni–Dunn correction (D). **P < 0.01; ***P < 0.001. |
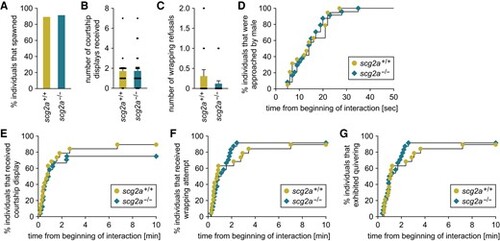
scg2a-deficient female medaka show no alterations in mating behavior. scg2a+/+ (n = 19) and scg2a−/− (n = 24) females of the Δ14 line were tested for mating behavior. A) Percentage of individuals that spawned within the test period (10 min). B, C) Number of courtship displays received (B) and wrapping refusals (C). D–G) Latency from the beginning of interaction to the first approach (D), first courtship display (E), first wrapping attempt (F), and quivering (G). Statistical differences were assessed by Fisher's exact test (A), unpaired t-test (B), unpaired t-test with Welch's correction (C), and Gehan–Breslow–Wilcoxon test (D–G) |