
|
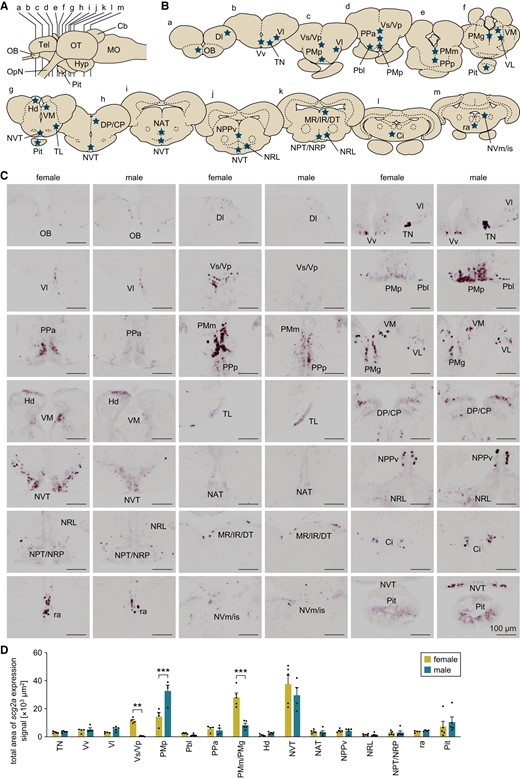
Fig. 4 scg2a shows region-specific sex differences in expression in the medaka brain. A) Lateral view (anterior to the left) of the medaka brain showing the approximate levels of coronal sections presented in panel B. Cb, cerebellum; Hyp, hypothalamus; MO, medulla oblongata; OB, olfactory bulb; OpN, optic nerve; OT, optic tectum; Pit, pituitary; Tel, telencephalon. B) Coronal sections showing the location of brain nuclei in which scg2a is expressed (stars). C) Representative micrographs depicting the expression of scg2a in the respective brain nuclei and pituitary of females and males. Scale bars represent 100 µm. For abbreviations of brain nuclei, see Table S1. D) Total area of scg2a expression signal in the respective brain nuclei and pituitary of females and males (n = 5 per sex). In brain nuclei other than these, signal was scarce and/or weak and could not be reliably quantitated. Statistical differences were assessed by unpaired t-test with Bonferroni–Dunn correction (D). **P < 0.01; ***P < 0.001.