
|
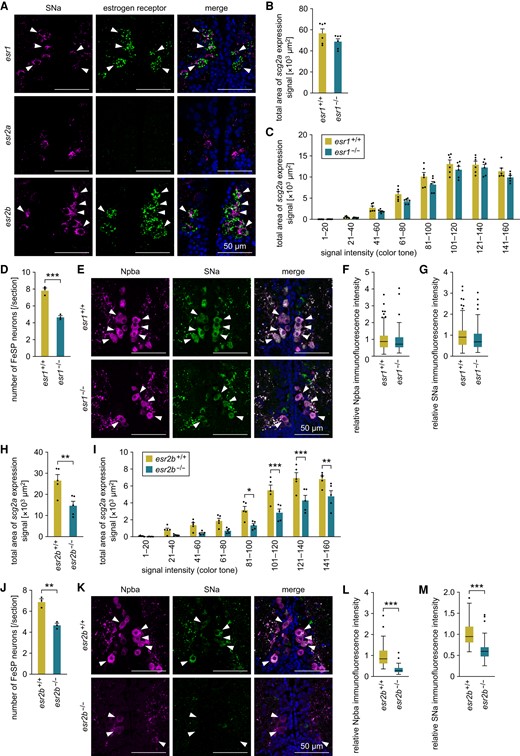
Fig. 2 The expression of scg2a in FeSP neurons is mediated by Esr2b. A) Representative micrographs showing the expression of estrogen receptors in Scg2a-expressing neurons in the PMm/PMg. Left and middle panels show images of SNa immunofluorescence (magenta) and estrogen receptor (esr1/esr2a/esr2b) transcript (green), respectively, in the same section; right panels show the merged images with nuclear counterstaining (blue). Arrowheads indicate representative Scg2a-expressing neurons that coexpress the indicated estrogen receptor. B) Total area of scg2a expression signal in the PMm/PMg of esr1+/+ and esr1−/− females (n = 6 for each genotype). C) Area of scg2a expression signal at different intensities in the PMm/PMg of esr1+/+ and esr1−/− females (n = 6 for each genotype). The x-axis indicates the signal intensity, with smaller numbers representing stronger intensity. D) Number of FeSP neurons per coronal section of the PMm/PMg of esr1+/+ and esr1−/− females (n = 3 for each genotype). E) Representative micrographs showing Npba (left panels; magenta) and SNa (middle panels; green) immunofluorescence in FeSP neurons (arrowheads) of esr1+/+ and esr1−/− females. Right panels show the merged images with nuclear counterstaining (blue). F, G) Relative intensity of Npba (F) and SNa (G) immunofluorescence in FeSP neurons of esr1+/+ (n = 94 neurons) and esr1−/− (n = 70 neurons) females. Mean intensity in esr1+/+ FeSP neurons was arbitrarily set to 1. H) Total area of scg2a expression signal in the PMm/PMg of esr2b+/+ and esr2b−/− females (n = 5 for each genotype). I) Area of scg2a expression signal at different intensities in the PMm/PMg of esr2b+/+ and esr2b−/− females (n = 5 for each genotype). The x-axis indicates the signal intensity, with smaller numbers representing stronger intensity. J) Number of FeSP neurons per coronal section of the PMm/PMg of esr2b+/+ and esr2b−/− females (n = 3 for each genotype). K) Representative micrographs showing Npba (left panels; magenta) and SNa (middle panels; green) immunofluorescence in FeSP neurons (arrowheads) of esr2b+/+ and esr2b−/− females. Right panels show the merged images with nuclear counterstaining (blue). L, M) Relative intensity of Npba (L) and SNa (M) immunofluorescence in FeSP neurons of esr2b+/+ (n = 70 neurons) and esr2b−/− (n = 72 neurons) females. Mean intensity in esr2b+/+ FeSP neurons was arbitrarily set to 1. Scale bars in all panels represent 50 μm. Statistical differences were assessed by unpaired t-test (B, D, F–H, J, M), unpaired t-test with Bonferroni–Dunn correction (C, I), and unpaired t-test with Welch's correction (L). *P < 0.05; **P < 0.01; ***P < 0.001.