
|
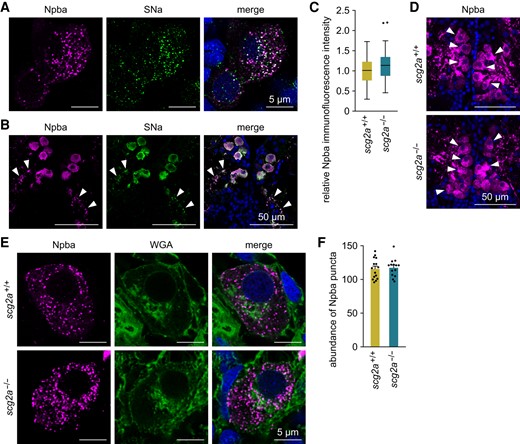
Fig. 3 Scg2a is not involved in neuropeptide packaging to secretory granules in FeSP neurons. A) Representative micrographs showing the distribution and colocalization of Npba and SNa polypeptides in FeSP neurons of wild-type females. Left and middle panels show images of Npba (magenta) and SNa (green) immunofluorescence, respectively, in the same section; right panel shows the merged image with nuclear counterstaining (blue). Scale bars represent 5 μm. B) Representative micrographs showing Npba (left panel; magenta) and SNa (middle panel; green) immunofluorescence in the axons of FeSP neurons (arrowheads). Right panel shows the merged image with nuclear counterstaining (blue). Scale bars represent 50 μm. C) Relative intensity of Npba immunofluorescence in FeSP neurons of scg2a+/+ (n = 87 neurons) and scg2a−/− (n = 80 neurons) females. Mean intensity in scg2a+/+ FeSP neurons was arbitrarily set to 1. D) Representative micrographs showing Npba immunofluorescence (magenta) in FeSP neurons (arrowheads) of scg2a+/+ and scg2a−/− females. Cell nuclei are shown in blue. Scale bars represent 50 μm. E) Representative micrographs showing the distribution of Npba puncta (left panels; magenta) in scg2a+/+ and scg2a−/− FeSP neurons, counterstained with WGA (middle panels; green). Right panels show merged images with nuclear counterstaining (blue). Scale bars represent 5 μm. F) Abundance of Npba puncta in FeSP neurons of scg2a+/+ (n = 15 neurons) and scg2a−/− (n = 14 neurons) females. Data in panels C–F were obtained from the Δ14 knockout line. Statistical differences were assessed by unpaired t-test (C, F)