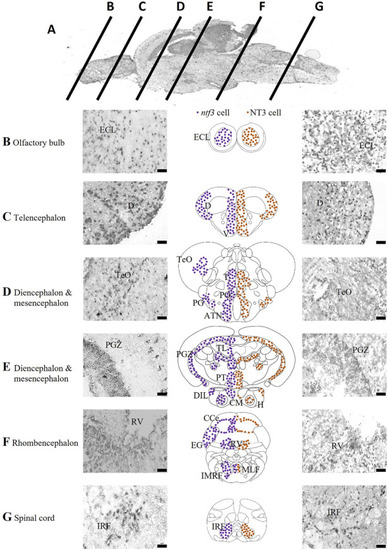
Localization of ntf3-and NT3-expressing cells. (A) Chromogenic ISH of the adult zebrafish brain with mid-sagittal view. Coronal sections at ×40 magnification of the zebrafish brain from the olfactory bulb (B), telencephalon (C), diencephalon and mesencephalon (D,E), rhombencephalon (F), to the spinal cord (G). Micrographs of the left panels showing ntf3 cells (ISH), and right panels showing NT3 cells (IHC). Schematic coronal drawings of the brain of zebrafish showing the distribution of ntf3 cells (purple dots) and NT3 cells (brown dots). Scale bar = 50 μm. ATN: anterior tuberal nucleus; CCe: cerebellum; (D) dorsal telencephalic area; DIL: inferior lobe of hypothalamus; ECL: external cellular layer of the olfactory bulb; EG: ementia granularis; H: periventricular area of hypothalamus; IMRF: intermediate reticular formation area; IRF: inferior reticular formation; LLF: lateral longitudinal fascicle; MLF: medial longitudinal fascicle; PGZ: periventricular zone of optic tectum; PO: parvocellular preoptic nucleus; PT: posterior tuberculum; RV: periventricular area of rhombencephalic ventricle; T: thalamic nuclei; TeO: optic tectum; TL: torus longitudinalis V: ventral telencephalic area.

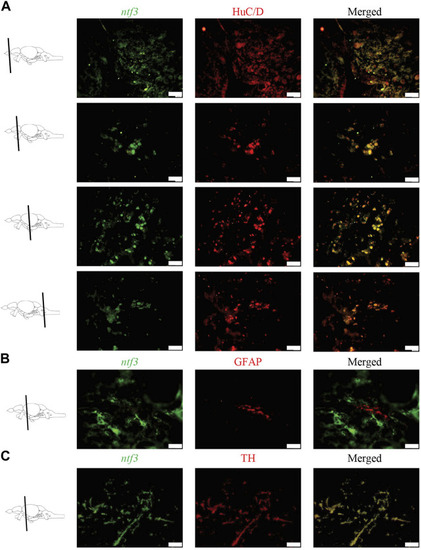
Double labelling fluorescence ISH with immunohistochemistry between ntf3 mRNA using a DIG-labelled probe and (A) neuronal (HuC/D), (B) glial (GFAP) and (C) catecholamine markers (TH). The co-localization of the neuronal and TH markers with the ntf3 mRNA was evident. However, this was not true for the glial marker. Scale bar = 50 μm.

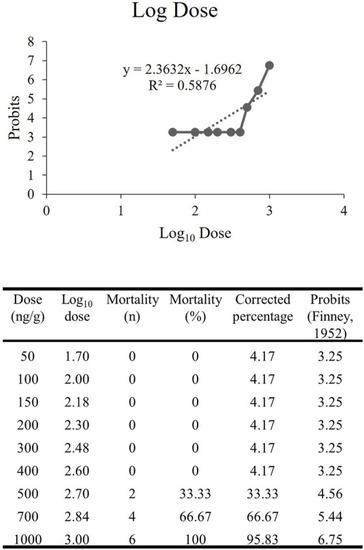
The extrapolated log10 dose versus the probits. The probits value is the standardized conversion value from the corrected mortality percentage adapted from Finney’s table (Hamidi et al., 2014).

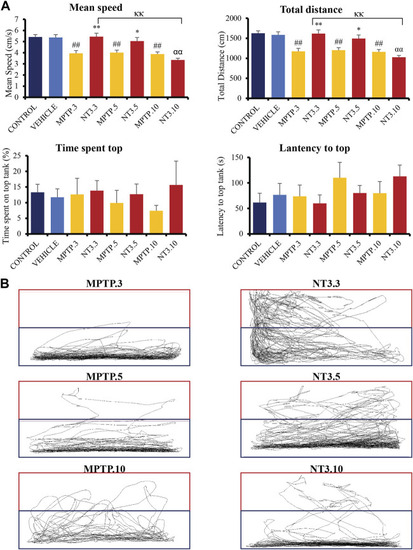
(A) Neurobehavioral analysis of the zebrafish group for control, vehicle, MPTP and NT3 treatment groups. The NT3 treatment group significantly improved swimming speed swimming distance, especially in the NT3.3 and NT3.5 groups compared to the corresponding MPTP group. Both NT3 treatment groups were equivocal statistically with the control and the vehicle groups. (B) The locomotor tracking between MPTP and NT3 groups where the exploration and the swimming tracts were evidently higher in NT3.3 and NT3.5 group compared to its corresponding MPTP group. However, the changes were not seen in the NT3.10 group. # describes the significant difference between the MPTP and vehicle groups with #p < 0.05, ##p < 0.01; * describes the statistically significant difference between the NT3 treatment group and its corresponding MPTP group with *p < 0.05, and **p < 0.01; α describes the significant difference between the NT3 group and the vehicle with α p < 0.05, αα p < 0.01; κ describes the significant difference between NT3.3, NT3.5 and NT3.5 with κ p < 0.05 and κκ p < 0.01.

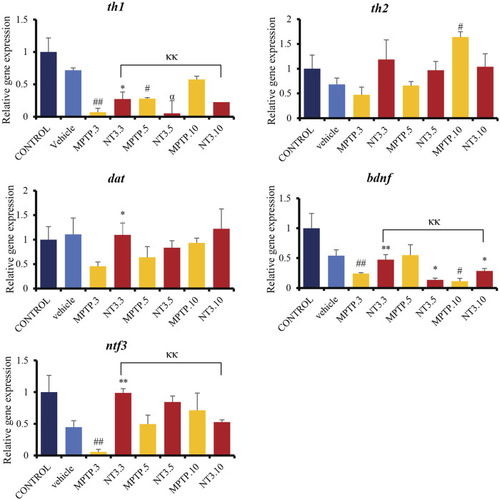
Gene expression between control, vehicle, MPTP and NT3 treatment groups. There was a significant downregulation in th1 gene expression in MPTP.3, which was reversed with NT3 treatment. dat gene has similar pattern with th2, where there was a steep increase in expression in dat in the MPTP group over 10 days, while the NT3 treatment group had a rather fluctuating pattern. dat gene was upregulated in NT3.3 group compared to the corresponding MPTP.3.NT3.3 group has been shown to reverse the downregulation of bdnf in the corresponding PD model and become equivocal to the vehicle group. Like bdnf, the ntf3 gene was downregulated in MPTP.3. Following that, a steady increase in gene regulation in MPTP.5 and MPTP.10 became equivocal to the vehicle group and the NT3 groups. # describes the significant difference between the MPTP and vehicle groups with #p < 0.05, ##p < 0.01; * describes the statistically significant difference between the NT3 treatment group and its corresponding MPTP group with *p < 0.05, and **p < 0.01; α describes the significant difference between the NT3 group and the vehicle with α p < 0.05, αα p < 0.01; κ describes the significant difference between NT3.3, NT3.5 and NT3.5 with κ p < 0.05 and κκ p < 0.01.

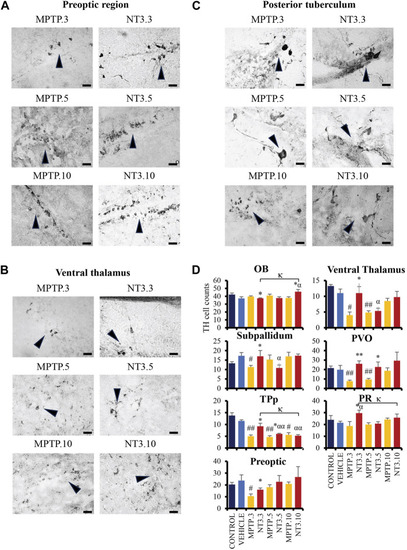
The comparative image of dopaminergic neurons between MPTP and NT3 groups. The TH cell counts in the MPTP group were markedly reduced in the preoptic region (A), ventral thalamus (B) and posterior tuberculum (C), compared to the NT3 group. (D) TH cell counts in all dopaminergic regions of the zebrafish brain. TH cells were seen to improve in the counts especially in day 3 group. However, becomes equivocal on day 10 of assessment. Arrowheads indicate TH cells. Scale bar = 50 μm. OB: olfactory bulb; PR: periventricular pretectal nucleus; PVO: paraventricular organ of posterior tuberculum; TPp: periventricular nucleus of posterior tuberculum. # describes the significant difference between the MPTP and vehicle groups with #p < 0.05, ##p < 0.01; * describes the statistically significant difference between the NT3 treatment group and its corresponding MPTP group with *p < 0.05, and **p < 0.01; α describes the significant difference between the NT3 group and the vehicle with α p < 0.05, αα p < 0.01; κ describes the significant difference between NT3.3, NT3.5 and NT3.5 with κ p < 0.05 and κκ p < 0.01.

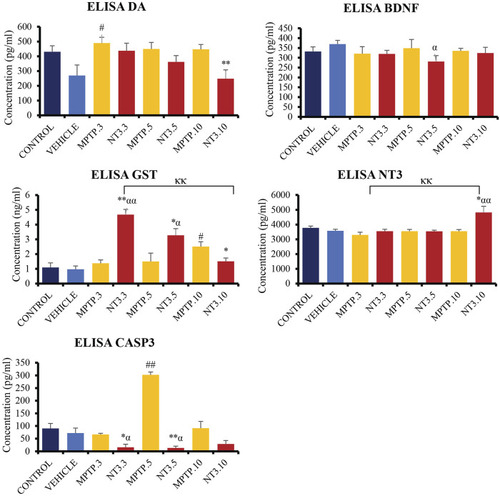
Quantification analysis of DA, CASP3, GST, BDNF and NT3 levels in the zebrafish brain. Interestingly, DA level showed a downward trend in NT3 groups compared to the PD model with the lowest level in day 10 group with highest NT3 level in the similar group. The CASP3 level was significantly lower with a higher GST level in NT3 groups than that in PD group especially in day 3 and day 5 groups. While BDNF was equivocal except for NT3.5 group where the level dropped compared to vehicle group, however equivocal to the corresponding PD group. # describes the significant difference between the MPTP and vehicle groups with #p < 0.05, ##p < 0.01; * describes the statistically significant difference between the NT3 treatment group and its corresponding MPTP group with *p < 0.05, and **p < 0.01; α describes the significant difference between the NT3 group and the vehicle with α p < 0.05, αα p < 0.01; κ describes the significant difference between NT3.3, NT3.5 and NT3.5 with κ p < 0.05 and κκ p < 0.01.

Acknowledgments
This image is the copyrighted work of the attributed author or publisher, and ZFIN has permission only to display this image to its users. Additional permissions should be obtained from the applicable author or publisher of the image. Full text @ Front Pharmacol