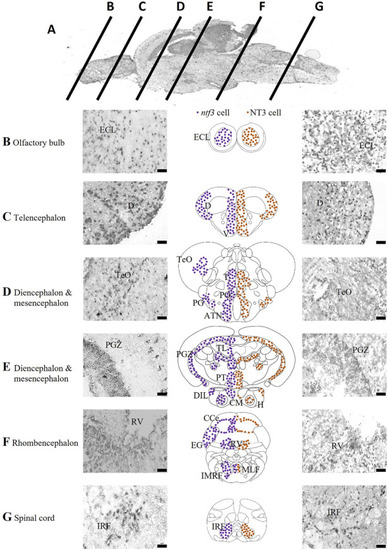
Localization of ntf3-and NT3-expressing cells. (A) Chromogenic ISH of the adult zebrafish brain with mid-sagittal view. Coronal sections at ×40 magnification of the zebrafish brain from the olfactory bulb (B), telencephalon (C), diencephalon and mesencephalon (D,E), rhombencephalon (F), to the spinal cord (G). Micrographs of the left panels showing ntf3 cells (ISH), and right panels showing NT3 cells (IHC). Schematic coronal drawings of the brain of zebrafish showing the distribution of ntf3 cells (purple dots) and NT3 cells (brown dots). Scale bar = 50 μm. ATN: anterior tuberal nucleus; CCe: cerebellum; (D) dorsal telencephalic area; DIL: inferior lobe of hypothalamus; ECL: external cellular layer of the olfactory bulb; EG: ementia granularis; H: periventricular area of hypothalamus; IMRF: intermediate reticular formation area; IRF: inferior reticular formation; LLF: lateral longitudinal fascicle; MLF: medial longitudinal fascicle; PGZ: periventricular zone of optic tectum; PO: parvocellular preoptic nucleus; PT: posterior tuberculum; RV: periventricular area of rhombencephalic ventricle; T: thalamic nuclei; TeO: optic tectum; TL: torus longitudinalis V: ventral telencephalic area.
|

