|
FIGURE 6
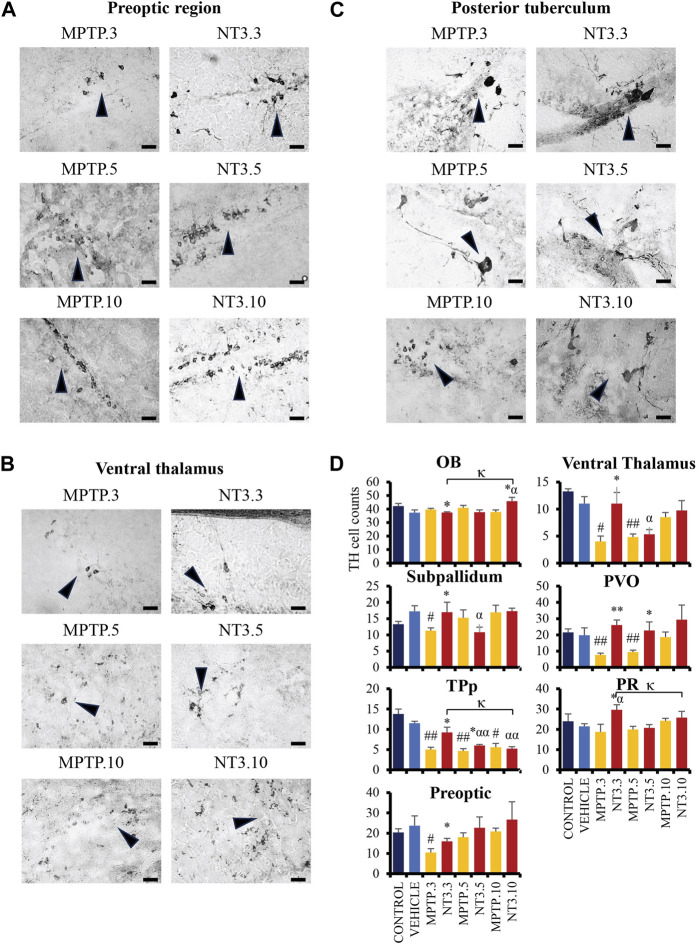
The comparative image of dopaminergic neurons between MPTP and NT3 groups. The TH cell counts in the MPTP group were markedly reduced in the preoptic region

|
|
FIGURE 6
The comparative image of dopaminergic neurons between MPTP and NT3 groups. The TH cell counts in the MPTP group were markedly reduced in the preoptic region