- Title
-
ERG potassium channels and T-type calcium channels contribute to the pacemaker and atrioventricular conduction in zebrafish larvae
- Authors
- Salgado-Almario, J., Molina, Y., Vicente, M., Martínez-Sielva, A., Rodríguez-García, R., Vincent, P., Domingo, B., Llopis, J.
- Source
- Full text @ Acta Physiol. (Oxf).
|
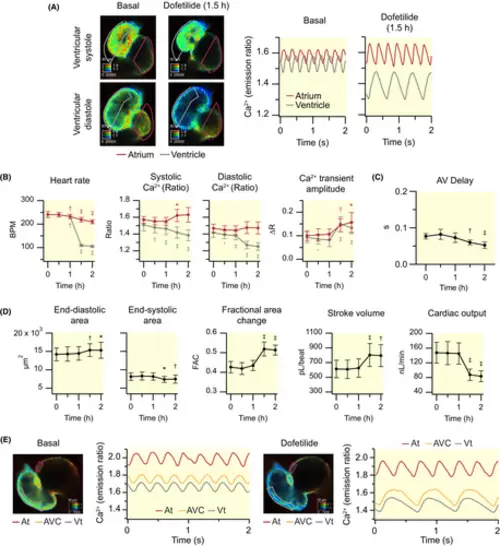
Effect of dofetilide on cardiac Ca2+ levels and ventricular contractility of 3 dpf zebrafish larvae. Dofetilide (100 μM) was added to Tg(myl7:Twitch-4) larvae at 3 dpf (N = 3, n = 9) after recording basal Ca2+ levels. (A) Emission ratio images of a representative larva before (basal) and after 1.5 h incubation with dofetilide. The calibration squares show the distance in μm (top side), the emission ratio coded in the hue (right side), and the fluorescence intensity (bottom side). The traces show the atrial (red) and ventricular (gray) Ca2+ levels (emission ratio). (B) Effect of dofetilide on heart rate, systolic and diastolic Ca2+ levels, and Ca2+ transient amplitude in the atrium (red) and ventricle (gray). (C) Effect of dofetilide on the AV delay (time between the start of atrial and ventricular Ca2+ transients). (D) Effect of dofetilide on ventricular areas, fractional area change, stroke volume, and cardiac output. (E) Effect of dofetilide on AV conduction in a 3 dpf zebrafish larva whose heart was stopped by incubation with the myosin inhibitor para-aminoblebbistatin (75 μM for 2 h) (representative experiment). ROIs were drawn as indicated to investigate the progression of the Ca2+ wave from the atrium (At), across the AV canal (AVC), and into the ventricle (Vt). The traces show the time course of the Ca2+ transients in each ROI. Data in B, C, and D are shown as the mean ± SD. Statistical analysis was performed using a one-way anova test with Dunnett's multiple comparisons post-test (*p < 0.05, †p < 0.01, ‡p < 0.001) |
|
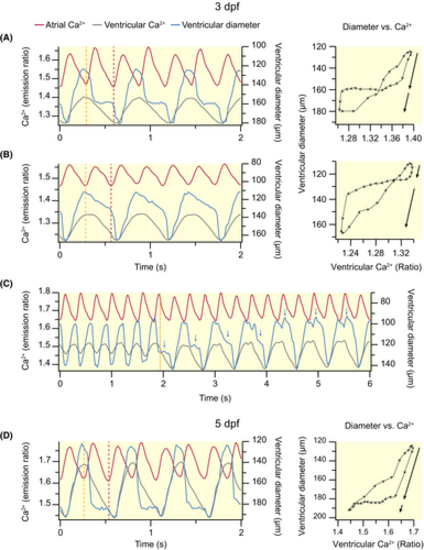
Alterations in ventricular filling during dofetilide-induced AV block in 3 (A–C) and 5 (D) dpf Tg(myl7:Twitch-4) zebrafish larvae. The traces show the atrial (red) and ventricular (gray) Ca2+ levels, and the major ventricular diameter (blue). The dashed lines indicate the start of the atrial CaT that was not conducted to the ventricle (orange), and the start of the next, conducted, atrial CaT (red). In some larvae (A), both blocked and conducted atrial contractions filled the ventricle with blood, whereas in others the first (B) or the second (D) atrial contraction hardly modified the ventricular diameter. Blue arrows in C indicate the level of ventricular filling at the end of the first atrial beat. The diagrams (diameter vs Ca2+) show the ventricular diameter versus ventricular Ca2+ level (one cardiac cycle) of representative larvae. The distance between arrowheads in these loops represents 20 ms, showing the direction of time and the relative speed of each phase. The black arrows show the two-step increase in ventricular diameter during ventricular filling. |
|
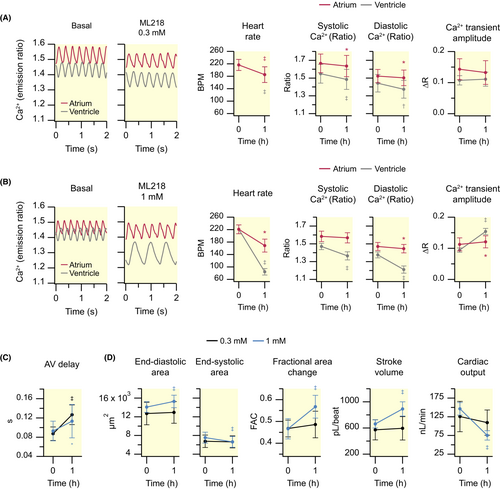
Effect of the T-type Ca2+ channel antagonist ML218 (0.3 and 1 mM) on cardiac Ca2+ levels and ventricular contractility of 3 dpf zebrafish larvae. Tg(myl7:Twitch-4) larvae at 3 dpf were treated with 0.3 mM (N = 3, n = 11) or 1 mM (N = 3, n = 12) ML218 for 1 h. Heart rate, systolic and diastolic Ca2+ levels, and Ca2+ transient amplitude in the atrium (red) and ventricle (gray) of larvae treated with 0.3 (A) or 1 mM (B) ML218. The traces in A and B show the atrial (red) and ventricular (gray) Ca2+ levels (emission ratio). AV delay (C), ventricular areas, fractional area change, stroke volume, and cardiac output (D) of larvae treated with 0.3 (black) or 1 mM (blue) ML218. Data are shown as the mean ± SD. Statistical analysis in A and B was performed using a paired Student's t test, as well as in C and D for 0.3 mM ML218. Differences in C and D for 1 mM ML218 were analyzed using a Wilcoxon test (*p < 0.05, †p < 0.01, ‡p < 0.001). |
|
Second-degree AV block of Mobitz type I in a representative 3 dpf zebrafish larva induced by the T-type Ca2+ channel antagonist ML218 (0.3 mM). (A) Emission ratio images before (basal) and after treatment with 0.3 mM ML218 for 1 h. The calibration squares are as described in Figure 1. (B) Atrial (red) and ventricular (gray) Ca2+ levels (emission ratio) before and after treatment with ML218. The red- and gray-dashed lines indicate the start of atrial and ventricular Ca2+ transients, respectively. (C) AV delay before and after treatment with ML218. (D) Time course of ventricular diameter before and after treatment with ML218. In this experiment, images were acquired at 100 frames/s. |


