Fig. 2
- ID
- ZDB-FIG-240405-9
- Publication
- Salgado-Almario et al., 2023 - ERG potassium channels and T-type calcium channels contribute to the pacemaker and atrioventricular conduction in zebrafish larvae
- Other Figures
- All Figure Page
- Back to All Figure Page
|
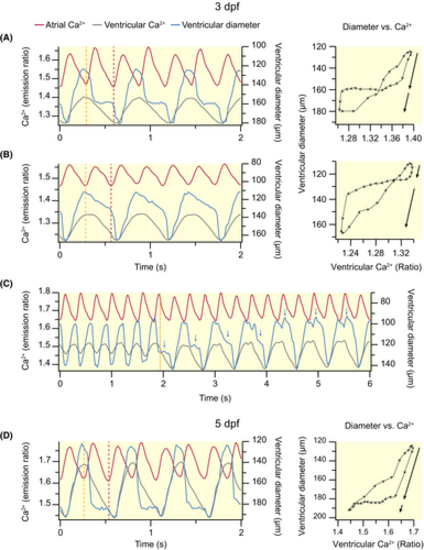
Alterations in ventricular filling during dofetilide-induced AV block in 3 (A–C) and 5 (D) dpf Tg(myl7:Twitch-4) zebrafish larvae. The traces show the atrial (red) and ventricular (gray) Ca2+ levels, and the major ventricular diameter (blue). The dashed lines indicate the start of the atrial CaT that was not conducted to the ventricle (orange), and the start of the next, conducted, atrial CaT (red). In some larvae (A), both blocked and conducted atrial contractions filled the ventricle with blood, whereas in others the first (B) or the second (D) atrial contraction hardly modified the ventricular diameter. Blue arrows in C indicate the level of ventricular filling at the end of the first atrial beat. The diagrams (diameter vs Ca2+) show the ventricular diameter versus ventricular Ca2+ level (one cardiac cycle) of representative larvae. The distance between arrowheads in these loops represents 20 ms, showing the direction of time and the relative speed of each phase. The black arrows show the two-step increase in ventricular diameter during ventricular filling. |

