
- Title
-
The streptococcal phase-variable type I restriction modification system SsuCC20p dictates the methylome of Streptococcus suis impacting the transcriptome and virulence in a zebrafish larvae infection model
- Authors
- Roodsant, T.J., van der Putten, B., Brizuela, J., Coolen, J.P.M., Baltussen, T.J.H., Schipper, K., Pannekoek, Y., van der Ark, K.C.H., Schultsz, C.
- Source
- Full text @ MBio
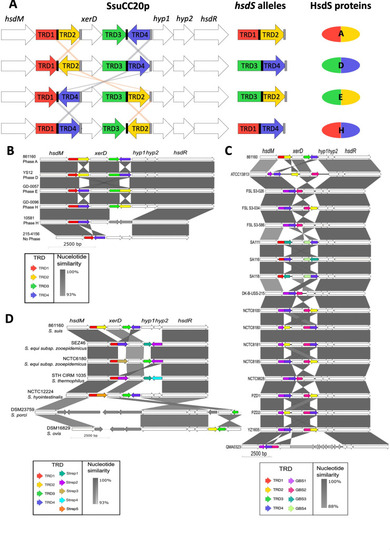
SsuCC20p presence in |
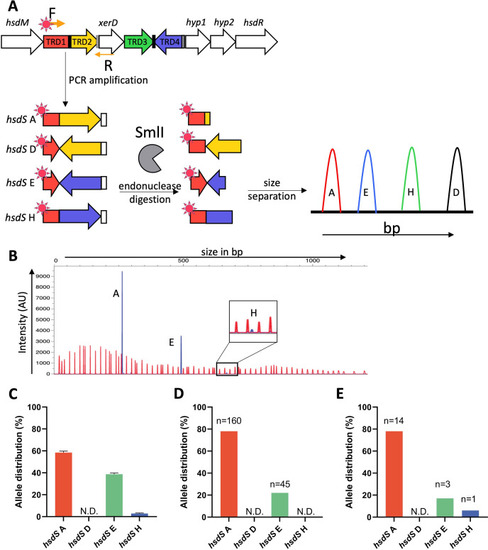
SsuCC20p is phase variable, and three alleles can be found within a single isolate. (A) Graphical representation of the hsdS allele quantification by FAM-labeled PCR product endonuclease digestion and fragment analysis. (B) Representative example of WT 861160 hsdS allele identification; red peaks are the LIZ1200 size marker, and blue peaks, the FAM-labeled fragments. (C) hsdS allele distribution was computed by measuring the relative area under the curve of the different hsdS alleles using PeakScanner v3.0 in three biological replicates. (D) hsdS alleles were quantified using PacBio or (E) Oxford Nanopore long-read sequencing data; read count per allele is indicated above each bar. N.D., not detected; AU, arbitrary units. |
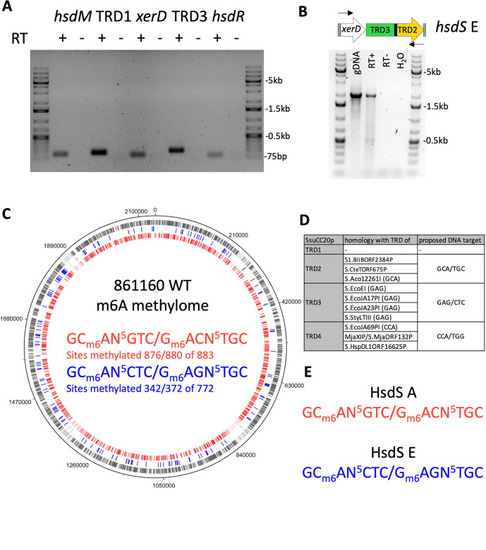
hsdS alleles downstream and upstream of xerD are expressed and methylate the genome. (A) Expression of SsuCC20p genes was verified by PCR on reverse-transcribed RNA, using gene-specific qPCR primers. PCR products were run on a 1% agarose gel. RT + or − indicates the presence of reverse transcriptase in the reverse transcription reaction; marker lanes were loaded with the 1 kb+ ladder. (B) PCR amplification of xerD-hsdS E fragment from genomic DNA (gDNA) and cDNA. RT + or − indicates the presence of reverse transcriptase in the reverse transcription reaction; marker lanes were loaded with the 1 kb+ ladder. (C) 861160 WT methylome; m6A methylated sites in genome are indicated on the genome with the color corresponding to the DNA motif; gray indicates sites that have either of the two DNA motif sites. (D) Homology of SsuCC20p TRDs to other type I RM system hsdS genes; identified DNA target sequences are indicated between brackets; for details, see Fig. S2. (E) Proposed target DNA motif of HsdS A and HsdS E. |
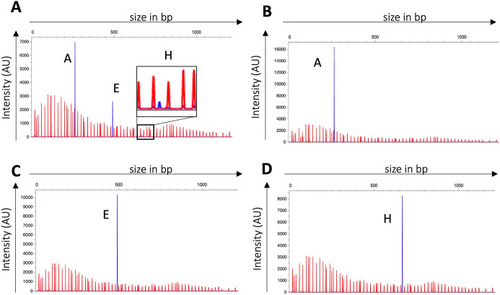
SsuCC20p phase variability is xerD dependent. (A) Representative example of WT (A) and AxerD (B–D) hsdS allele identification after subculturing in THY broth. Red peaks are the LIZ1200 size marker, and blue peaks, the FAM-labelled fragments; hsdS allele identification was analyzed with PeakScanner v3.0 in three biological replicates. AxerD mutants showed a single hsdS allele, which was hsdS A, E, or H depending on the hsdS allele present in the genome upon mutating xerD. |
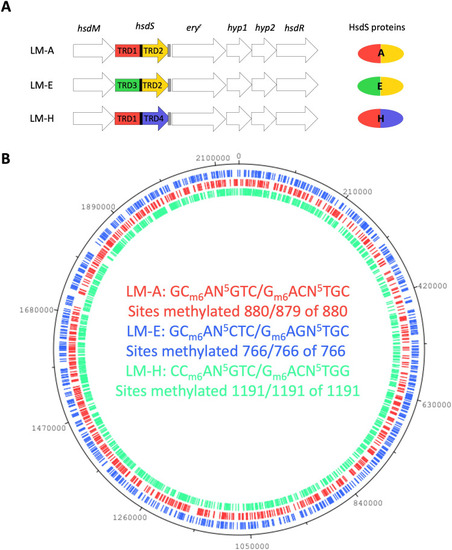
Locked mutants (LMs) have unique m6A methylation patterns. (A) Graphical representation of the SsuCC20p locus in the LMs. (B) The LM methylation patterns were plotted on the 861160 WT genome; m6A methylated sites in the genome are indicated on the genome with the color corresponding to the DNA motif. |
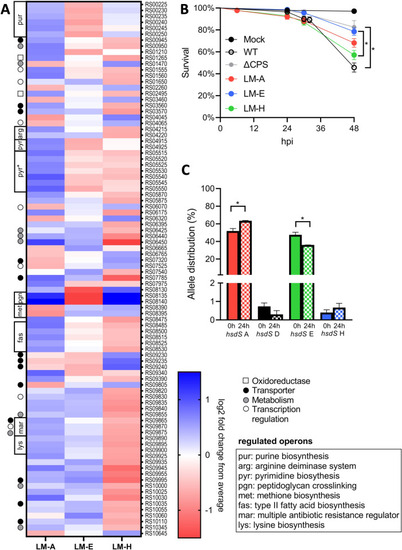
Locked mutants have distinct transcriptomes and virulence in a zebrafish larvae infection model. (A) Heatmap of the 90 differentially expressed genes (>2-fold, PHENOTYPE:
|