IMAGE

Fig 6

ID
ZDB-IMAGE-240117-6
Source
Figures for Roodsant et al., 2023
Image
Figure Caption

Fig 6

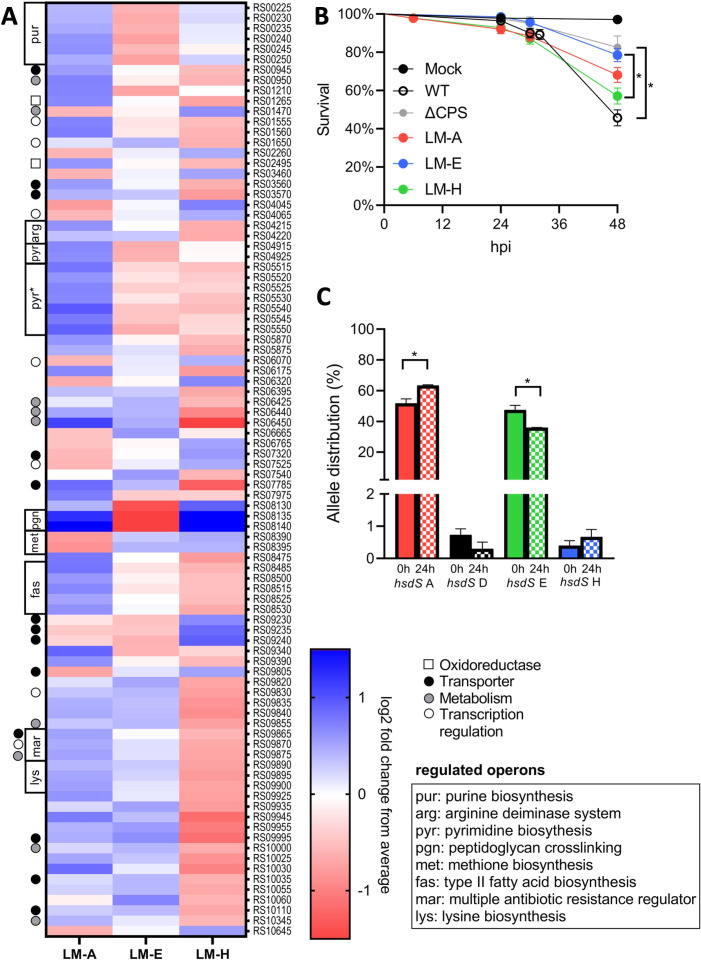
Locked mutants have distinct transcriptomes and virulence in a zebrafish larvae infection model. (A) Heatmap of the 90 differentially expressed genes (>2-fold, P < 0.05 ). Log2 fold change is expressed relative to the average of the three LMs. Scale endpoints are not absolute; genes with relative higher or lower expression have the endpoint color. pyr*, operon also contains genes predicted not to be involved in pyrimidine biosynthesis. For the RNA sequencing, two biological replicates for LM-A and three for LM-E and LM-H were used. (B) Zebrafish larvae (72 hours post fertilization) were infected via yolk sac injection with 2,700 CFU of S. suis, and survival was followed for 48 hours post infection (hpi). Per group, 20 larvae were infected in three to eight separate experiments. Data from individual experiments were pooled, and statistical difference was determined using a log-rank (Mantel-Cox) test with a Bonferroni correction for multiple testing. *P < 0.001. (C) hsdS allele distribution in WT 861160 at 0 hpi and 24 hpi in the zebrafish larvae. Allele abundance was computed by measuring the relative area under the curve of the different hsdS alleles using PeakScanner v3.0 in three biological replicates. Statistical differences was determined by a one-way analysis of variance with a Bonferroni correction for multiple testing. *P < 0.001.

Figure Data
Acknowledgments
This image is the copyrighted work of the attributed author or publisher, and ZFIN has permission only to display this image to its users. Additional permissions should be obtained from the applicable author or publisher of the image. Full text @ MBio