
Image
|
Figure Caption
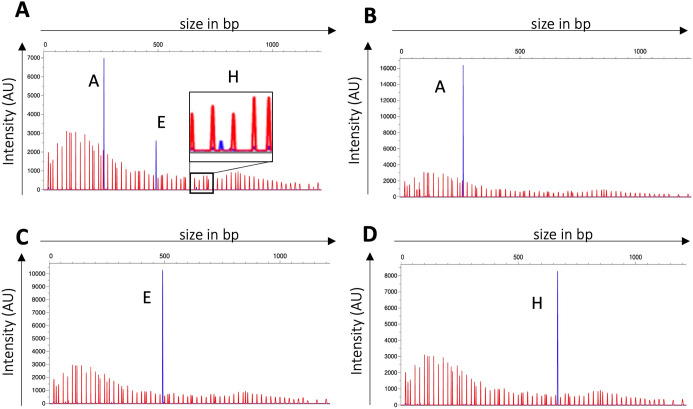
Fig 4
SsuCC20p phase variability is xerD dependent. (A) Representative example of WT (A) and AxerD (B–D) hsdS allele identification after subculturing in THY broth. Red peaks are the LIZ1200 size marker, and blue peaks, the FAM-labelled fragments; hsdS allele identification was analyzed with PeakScanner v3.0 in three biological replicates. AxerD mutants showed a single hsdS allele, which was hsdS A, E, or H depending on the hsdS allele present in the genome upon mutating xerD.
Acknowledgments
This image is the copyrighted work of the attributed author or publisher, and
ZFIN has permission only to display this image to its users.
Additional permissions should be obtained from the applicable author or publisher of the image.
Full text @ MBio