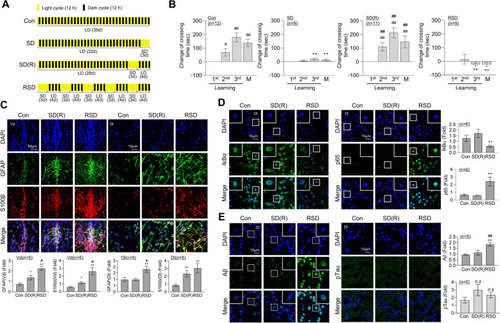
SD- or RSD-induced L/M deficits, neuroinflammation, and Aβ accumulation in the brain of adult zebrafish. For sleep deprivation (SD), zebrafish were exposed to extended light for 72 h (3 days). After SD, the fish had a 4-day recovery period with a normal sleep–wake pattern (SD (R)). Repetitive sleep deprivation (RSD) involved five repeated cycles of SD (R). A Experimental schematic illustration of SD, SD (R), and RSD. B Graphs represent the contextual L/M test, showing altered crossing times compared to those observed during the first learning session. Values represent the mean ± SEM (n = 9–11/group). For statistical analysis, a within-group comparison was conducted using the Friedman ANOVA test with the original Benjamini and Hochberg false discovery rate (FDR). (ap < 0.05, aap < 0.01 versus 1st learning). A two-way ANOVA with Tukey’s multiple comparisons test was performed for between-group comparisons (*p < 0.05, **p < 0.01 versus Con, ##p < 0.01 versus SD). CE Representative confocal images (× 40) of DAPI (blue), GFAP (C, green), S100β (C, red), IκBα (D, left, green), p65 (D, right, green), Aβ (E, left, green), pTau (E, right, green), and merged immunofluorescence staining are shown for the dorsal nucleus of the Vd or Dl region of the telencephalic area in zebrafish brain. Enlarged images are presented within white boxes. The graphs display the quantitative results for each antibody with normalization based on DAPI levels (n = 5 ~ 6/group). For statistical analysis, the Kruskal–Wallis test with the original Benjamini and Hochberg FDR was conducted (*p < 0.05, **p < 0.01 versus Con, #p < 0.05, ##p < 0.01 versus SD(R))

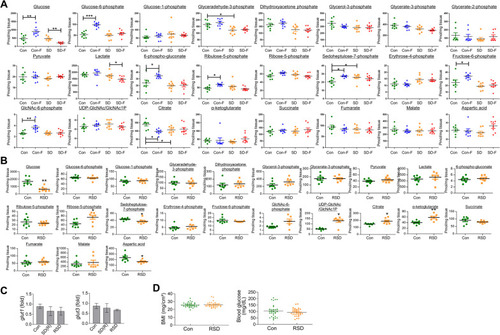
Changes in glucose metabolites in brains of control, SD and RSD zebrafish.
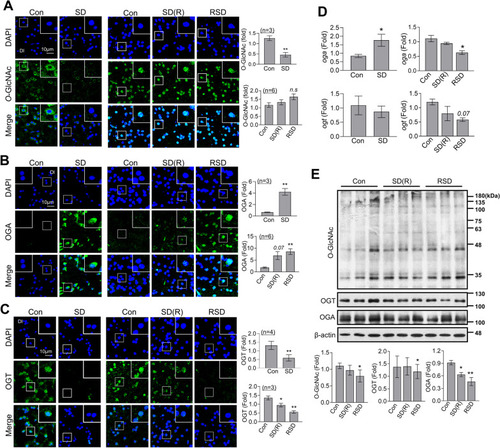
 A Graphs represent quantification of selected glucose metabolites by GC–MS/MS in the brains of control and SD zebrafish with or without the fear context. A fear context memory test was conducted after the SD. After a 6-h interval following the memory test, the brains were sacrificed for metabolic analysis. The Mann–Whitney U test was used for statistical comparisons of groups (*p < 0.05 and **p < 0.01). Cont, control; Con-F, 6 h after fear context in control group; SD, sleep-deprivation; SD-F, 6 h after fear context in SD group. B Graphs represent quantification of selected glucose metabolites using GC–MS/MS in the brains of control and RSD zebrafish. Statistical analysis was carried out by Mann–Whitney U test (*p < 0.05 and **p < 0.01 versus Con). C mRNA expression levels of pooled brain samples (n = 3/group) were measured using quantitative real-time PCR with specific primers. The data represent the mean ± SEM of target gene expression normalized to β-actin levels using the delta–delta Ct method. The experiments were independently replicated three times. Statistical analysis was performed using the Kruskal–Wallis test (n.s). D Zebrafish BMI and blood glucose levels were analyzed and compared with the control group following RSD induction. The height and weight of fish were measured to calculate BMI using the formula BMI = mg/cm2. Blood glucose levels were measured from the zebrafish tail blood samples. The values are displayed as the mean ± SEM, and individual values are represented by dots (n = 30 ~ 36/group). Statistical analysis was performed using the Mann–Whitney test (n.s)

OGT, OGA and O-GlcNAcylation changes following SD or RSD. The zebrafish brains were sacrificed for analysis after the induction of SD, SD(R), or RSD. AC Representative confocal images (× 40) of DAPI (blue), O-GlcNAc (A, green), OGA (B, green), OGT (C, green), and merged immunofluorescence staining are shown for the Dl region of the zebrafish telencephalon. Enlarged images are presented within white boxes. The graphs represent the quantitative results for each antibody, normalized to the DAPI levels (n = 3 ~ 6/group). D mRNA expression levels of pooled brain samples (n = 3/group) were measured using quantitative real-time PCR with specific primers. Data represent the mean ± SEM of target gene expression, normalized to β-actin levels using the delta–delta Ct method. The experiments were independently replicated three times. E Representative Western blot images of O-GlcNAc, OGT, OGA, and β-actin from zebrafish whole brains (n = 9/group). The graphs represent the quantitative results for each antibody, normalized to the β-actin levels. For statistical analysis, the Mann–Whitney test was performed for the two group comparisons, while the Kruskal–Wallis test with the original Benjamini and Hochberg false FDR was used for comparisons involving more than three groups (*p < 0.05, **p < 0.01 versus Con)

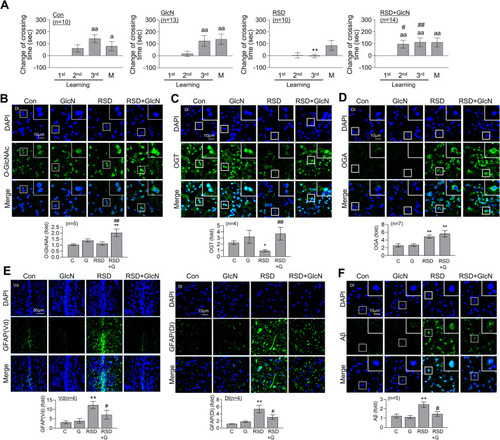
Restoration of RSD-induced L/M deficit, astrocyte activation, and Aβ accumulation by GlcN treatment. Zebrafish were intraperitoneally injected with GlcN (20 μg/g) on the day of SD exposure during each episode of SD throughout 5 cycles of RSD. After the final RSD induction, the fear context L/M test and brain analysis were conducted. A Graphs depict the results of fear context L/M tests conducted after the RSD induction, comparing groups with or without GlcN injection. The graphs represent the altered crossing times compared to those observed during the first learning session and display the mean ± SEM (n = 10 ~ 14/group). For within-group comparisons, statistical analysis was performed using the Friedman ANOVA test with the original Benjamini and Hochberg FDR (ap < 0.05, aap < 0.01 versus 1st learning). A between-group comparison was conducted using a two-way ANOVA with Tukey’s multiple comparisons test (**p < 0.01 versus Con, #p < 0.05, ##p < 0.01 versus RSD). BF Representative confocal images (× 40) of DAPI (blue), GFAP (B, green), O-GlcNAc (C, green), OGT (D, green), OGA (E, green), Aβ (F, green), and merged immunofluorescence staining are shown for the Dl and Vd regions of the zebrafish telencephalon. Enlarged images are presented within white boxes. The graphs display the quantitative results for each antibody, normalized to the DAPI levels (n = 4 ~ 7/group). For statistical analysis, the Kruskal–Wallis test with the original Benjamini and Hochberg FDR was performed (*p < 0.05, **p < 0.01 versus Con, #p < 0.05, ##p < 0.01 versus RSD)

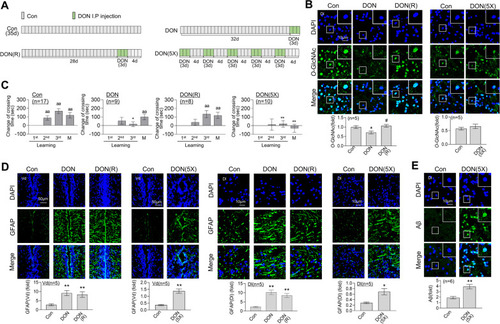
Induction of L/M dysfunction, O-GlcNAcylation decrease, and enhanced astrocyte activation and Aβ accumulation by DON treatment. DON (500 ng/g) was administered via single or multiple cycles of intraperitoneal injections: three consecutive DON treatments (DON), 4 days of recovery without DON following the initial treatment (DON (R)), and a total of 5 cycles consisting of 3 days of DON injections with 4 days of recovery in between (DON (5X)). A day after the final cycle of DON injections, the fear context L/M test or brain analysis was conducted. A Schematic experimental design and procedure of DON, DON (R), and DON (5X). B Representative confocal images (× 40) of DAPI (blue), O-GlcNAc (green), and merged are immunofluorescence staining of the Dl region of zebrafish telencephalon. Enlarged images are presented in the white boxes. The graphs represent the quantitative results for each antibody with normalization by the DAPI levels (n = 5 ~ 6/group). Statistical analysis was performed using the Kruskal–Wallis test with the original FDR of Benjamini and Hochberg (*p < 0.05 versus Con, #p < 0.05 versus DON). C Graphs represent the results of fear context L/M test after different schemes of DON injection. They depict the altered crossing times compared to those observed during the first learning session and display the mean ± SEM (n = 8 ~ 17/group). For statistical analysis, a within-group comparison was performed using the Friedman ANOVA test with the original FDR of Benjamini and Hochberg (ap < 0.05, aap < 0.01 versus 1st learning). Between the group comparison, a two-way ANOVA with Tukey’s multiple comparisons test was performed (*p < 0.05, **p < 0.01 versus Con). (D and E) Representative confocal images (40x) of DAPI (blue), GFAP (D, green), Aβ (E, green), and merged immunofluorescence staining in the Dl and Vd regions of zebrafish telencephalon are shown. Enlarged images are presented in the white boxes. The graphs represent the quantitative results for each antibody with normalization by the DAPI levels (n = 5 ~ 6/group). For statistical analysis, the Mann–Whitney test was performed the two-group comparisons, while the Kruskal–Wallis test with the original Benjamini and Hochberg false FDR was used for comparisons involving more than three groups (*p < 0.05, **p < 0.01 versus Con)

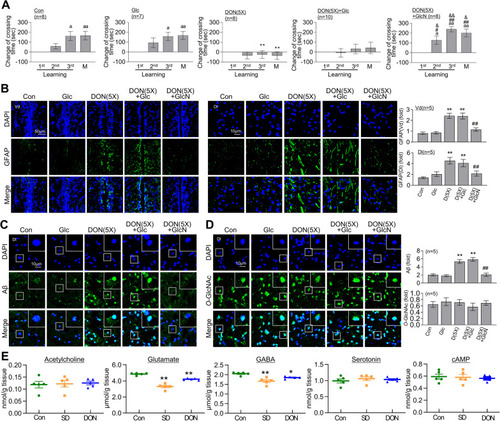
Restoration of DON induced L/M defect, astrocyte activation and Aβ accumulation by GlcN. DON (500 ng/g) was intraperitoneally injected for 5 cycles, with each cycle consisting of 3 days of injection followed by 4 days of recovery (DON (5X)). Some groups received an additional intraperitoneal injection of glucose (Glc, 20 μg/g) or GlcN (20 μg/g). After the final cycle of DON injections, fear context L/M test or brain analysis was conducted. A Graphs represent the results of the fear context L/M test for the DON (5X) group with or without Glc or GlcN injection. They illustrate the altered crossing times compared to those observed during the first learning session and display the mean ± SEM (n = 7 ~ 10/group). For within-group comparisons, the Friedman ANOVA test was performed with the original FDR correction method of Benjamini and Hochberg. (ap < 0.05, aap < 0.01 versus 1st learning). For between-group comparisons, a two-way ANOVA with Tukey’s multiple comparisons test was performed (*p < 0.05, **p < 0.01 versus Con, #p < 0.05, ##p < 0.01 versus DON (5X), &p < 0.05, &&p < 0.01 versus RD + Glc). BD Representative confocal images (40×) of DAPI (blue), GFAP (B, green), Aβ (C, green), O-GlcNAc (D, green), and merged immunofluorescence staining in the Dl and Vd regions of zebrafish telencephalon are displayed. Enlarged images are presented in the white boxes. The graphs represent the quantitative results for each antibody with normalization by the DAPI levels (n = 5/group). For statistical analysis, the Kruskal–Wallis test with the original FDR of Benjamini and Hochberg was performed (*p < 0.05, **p < 0.01 versus Con, ##p < 0.01 versus DON (5X)). E The graphs represent the levels of acetylcholine, glutamate, GABA, serotonin, and cAMP in zebrafish brains (n = 5/sample) 1 day after SD or DON treatment. For statistical analysis, the one-way ANOVA with post hoc Tukey’s multiple comparison tests were performed. The data are presented as the mean ± SEM (*p < 0.05, **p < 0.01 versus Con)

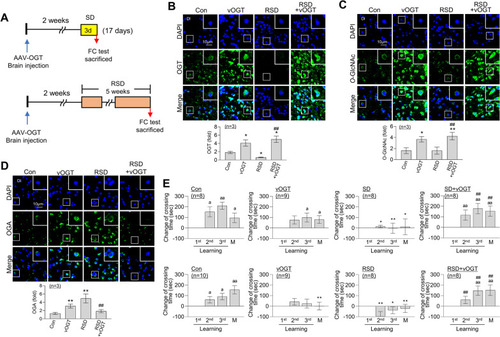
Restoration of RSD-induced L/M deficit by overexpression of OGT. An vOGT virus was injected into the brains of zebrafish. A Schematic illustrating the experimental design of vOGT (vOGT) injection and induction of either SD or RSD. BD Representative confocal images (40×) of DAPI (blue), OGT (B, green), O-GlcNAc (C, green), OGA (D, green), and merged immunofluorescence staining in the Dl region of zebrafish telencephalon are displayed. Enlarged images are presented in the white boxes. The graphs represent the quantitative results for each antibody with normalization by the DAPI levels (n = 3/group). For statistical analysis, the Kruskal–Wallis test with the original FDR of Benjamini and Hochberg was performed (*p < 0.05, **p < 0.01 versus Con, ##p < 0.01 versus RSD). E Graphs represent fear context L/M test results for the SD or RSD group with or without vOGT injection. They illustrate the altered crossing times compared to those observed during the first learning session and display the mean ± SEM (n = 8 ~ 10/group). For statistical analysis, within-group comparisons, the Friedman ANOVA test was performed with the original FDR of Benjamini and Hochberg (ap < 0.05, aap < 0.01 versus 1st learning). Between-group comparisons, a two-way ANOVA with Tukey’s multiple comparisons test was performed (*p < 0.05, **p < 0.01 versus Con, ##p < 0.01 versus SD or RSD)

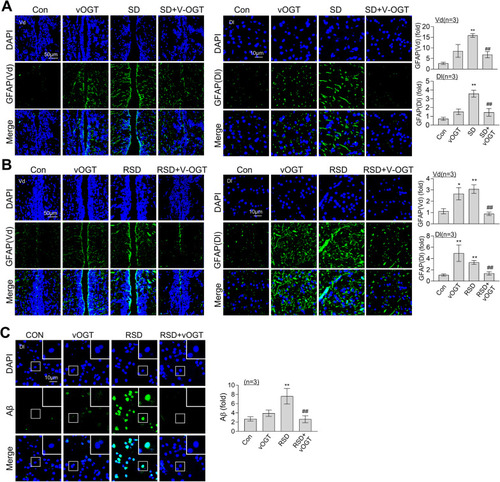
Suppression of RSD-induced astrocyte activation and Aβ accumulation by overexpression of OGT. An vOGT virus was injected into the brains of zebrafish. Representative confocal images (40×) of DAPI (blue), GFAP (A and B, green), Aβ (C, green), and merged immunofluorescence staining in the Dl or Vd regions of zebrafish telencephalon are displayed. Enlarged images are presented in the white boxes. The graphs represent the quantitative results for each antibody with normalization by the DAPI levels (n = 3/group). For statistical analysis, the Kruskal–Wallis test with the original FDR of Benjamini and Hochberg was performed (*p < 0.05,  **p < 0.01 versus Con, ##p < 0.01 versus SD or RSD)

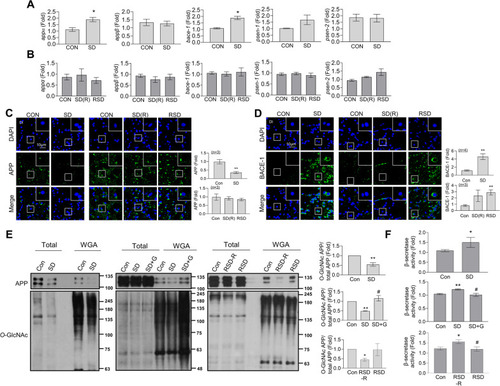
SD-induced increase in mRNA levels of APP and β-secretase expression, and decrease in APP O-GlcNAcylation. Zebrafish brains were analyzed after exposure to SD or RSD, with or without a recovery period, as well as after RSD without recovery (RSD-R). In some conditions, intraperitoneal GlcN (20 μg/g) was administered. After the induction of SD, SD(R), RSD-R, or RSD, the zebrafish brains were sacrificed. A, B mRNA expression levels of pooled brain samples (n = 3/group) were measured using quantitative real-time PCR with specific primers. Values are presented as the mean ± SEM for each target gene expression, normalized to β-actin levels using the delta–delta Ct method. The experiments were independently replicated three times. For statistical analysis, the Mann–Whitney test was used for the two-group comparisons, and the Kruskal–Wallis test with the original FDR of Benjamini and Hochberg was used for comparisons involving more than three groups (*p < 0.05 versus Con). C Representative confocal images (40x) of DAPI (blue), APP (C, green), BACE-1 (D, green), and merged immunofluorescence staining in the Dl region of zebrafish brain are displayed. Enlarged images are presented in the white boxes. The graphs represent the quantitative results for each antibody with normalization to the DAPI levels (n = 3 ~ 4/group). For statistical analysis, the Mann–Whitney test was performed the two-group comparisons, while the Kruskal–Wallis test with the original Benjamini and Hochberg false FDR was used for comparisons involving more than three groups (**p < 0.01 versus Con). D WGA pull-down assays were performed using total protein extracted from whole brains of zebrafish (3 brain pools per group). The total cell lysates were incubated with WGA agarose, and the proteins bound to WGA were analyzed using Western blot assay with specific antibodies. The graphs represent the quantitative results for the level of WGA-bound APP, normalized to the total APP levels. The experiments were independently replicated three times. For statistical analysis, the Mann–Whitney test was performed (*p < 0.05, **p < 0.01 versus Con, #p < 0.05 versus SD). E β-Secretase activities were measured in the whole brain of zebrafish (n = 4 ~ 5/group). Values are presented as the mean ± SEM. For statistical analysis, the Mann–Whitney test was performed for the two-group comparisons, and the Kruskal–Wallis test with the original FDR of Benjamini and Hochberg was performed for comparisons involving more than three groups (*p < 0.05, **p < 0.01 versus Con, #p < 0.05 versus SD or RSD-R)

Acknowledgments
This image is the copyrighted work of the attributed author or publisher, and ZFIN has permission only to display this image to its users. Additional permissions should be obtained from the applicable author or publisher of the image. Full text @ J Neuroinflammation