FIGURE

Fig. 6

ID
ZDB-FIG-231113-31
Publication
Park et al., 2023 - Repeated sleep deprivation decreases the flux into hexosamine biosynthetic pathway/O-GlcNAc cycling and aggravates Alzheimer's disease neuropathology in adult zebrafish
Other Figures
All Figure Page
Back to All Figure Page
Fig. 6

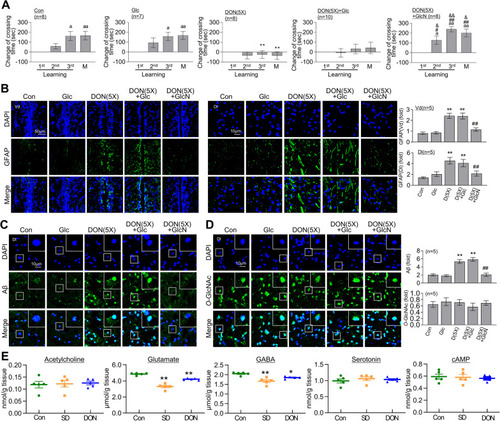
Restoration of DON induced L/M defect, astrocyte activation and Aβ accumulation by GlcN. DON (500 ng/g) was intraperitoneally injected for 5 cycles, with each cycle consisting of 3 days of injection followed by 4 days of recovery (DON (5X)). Some groups received an additional intraperitoneal injection of glucose (Glc, 20 μg/g) or GlcN (20 μg/g). After the final cycle of DON injections, fear context L/M test or brain analysis was conducted. A Graphs represent the results of the fear context L/M test for the DON (5X) group with or without Glc or GlcN injection. They illustrate the altered crossing times compared to those observed during the first learning session and display the mean ± SEM (n = 7 ~ 10/group). For within-group comparisons, the Friedman ANOVA test was performed with the original FDR correction method of Benjamini and Hochberg. (ap < 0.05, aap < 0.01 versus 1st learning). For between-group comparisons, a two-way ANOVA with Tukey’s multiple comparisons test was performed (*p < 0.05, **p < 0.01 versus Con, #p < 0.05, ##p < 0.01 versus DON (5X), &p < 0.05, &&p < 0.01 versus RD + Glc). BD Representative confocal images (40×) of DAPI (blue), GFAP (B, green), Aβ (C, green), O-GlcNAc (D, green), and merged immunofluorescence staining in the Dl and Vd regions of zebrafish telencephalon are displayed. Enlarged images are presented in the white boxes. The graphs represent the quantitative results for each antibody with normalization by the DAPI levels (n = 5/group). For statistical analysis, the Kruskal–Wallis test with the original FDR of Benjamini and Hochberg was performed (*p < 0.05, **p < 0.01 versus Con, ##p < 0.01 versus DON (5X)). E The graphs represent the levels of acetylcholine, glutamate, GABA, serotonin, and cAMP in zebrafish brains (n = 5/sample) 1 day after SD or DON treatment. For statistical analysis, the one-way ANOVA with post hoc Tukey’s multiple comparison tests were performed. The data are presented as the mean ± SEM (*p < 0.05, **p < 0.01 versus Con)

Expression Data

Expression Detail
Antibody Labeling
Phenotype Data

Phenotype Detail
Acknowledgments
This image is the copyrighted work of the attributed author or publisher, and ZFIN has permission only to display this image to its users. Additional permissions should be obtained from the applicable author or publisher of the image. Full text @ J Neuroinflammation