IMAGE

Fig. 4

ID
ZDB-IMAGE-231113-29
Source
Figures for Park et al., 2023
Image
Figure Caption

Fig. 4

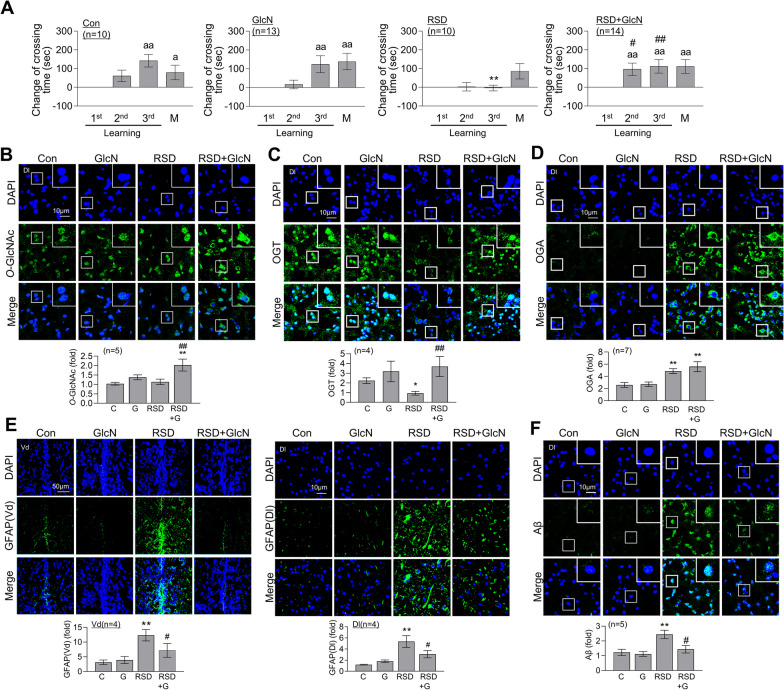
Restoration of RSD-induced L/M deficit, astrocyte activation, and Aβ accumulation by GlcN treatment. Zebrafish were intraperitoneally injected with GlcN (20 μg/g) on the day of SD exposure during each episode of SD throughout 5 cycles of RSD. After the final RSD induction, the fear context L/M test and brain analysis were conducted. A Graphs depict the results of fear context L/M tests conducted after the RSD induction, comparing groups with or without GlcN injection. The graphs represent the altered crossing times compared to those observed during the first learning session and display the mean ± SEM (n = 10 ~ 14/group). For within-group comparisons, statistical analysis was performed using the Friedman ANOVA test with the original Benjamini and Hochberg FDR (ap < 0.05, aap < 0.01 versus 1st learning). A between-group comparison was conducted using a two-way ANOVA with Tukey’s multiple comparisons test (**p < 0.01 versus Con, #p < 0.05, ##p < 0.01 versus RSD). BF Representative confocal images (× 40) of DAPI (blue), GFAP (B, green), O-GlcNAc (C, green), OGT (D, green), OGA (E, green), Aβ (F, green), and merged immunofluorescence staining are shown for the Dl and Vd regions of the zebrafish telencephalon. Enlarged images are presented within white boxes. The graphs display the quantitative results for each antibody, normalized to the DAPI levels (n = 4 ~ 7/group). For statistical analysis, the Kruskal–Wallis test with the original Benjamini and Hochberg FDR was performed (*p < 0.05, **p < 0.01 versus Con, #p < 0.05, ##p < 0.01 versus RSD)

Acknowledgments
This image is the copyrighted work of the attributed author or publisher, and ZFIN has permission only to display this image to its users. Additional permissions should be obtained from the applicable author or publisher of the image. Full text @ J Neuroinflammation