
- Title
-
FAM91A1-TBC1D23 complex structure reveals human genetic variations susceptible for PCH
- Authors
- Zhao, L., Deng, H., Yang, Q., Tang, Y., Zhao, J., Li, P., Zhang, S., Yong, X., Li, T., Billadeau, D.D., Jia, D.
- Source
- Full text @ Proc. Natl. Acad. Sci. USA
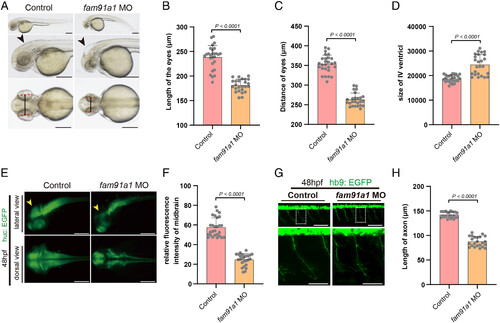
FAM91A1 is required for zebrafish neuronal development and brain growth. (A) Bright-field images of zebrafish embryos of control and fam91a1 MO zebrafish based on head and body morphology at 48 hpf (hours post fertilization). The dotted red line indicates eye length, the black solid line indicates eye distance, and the black arrows indicate the fourth ventricle. Control: control MO injection; fam91a1 MO: fam91a1 MO injection. All injections are performed at one cell stage of the development (Scale bar, 100 μm). (B) The length of eyes of embryos in control and fam91a1 MO zebrafish at 48 hpf. Experiments were repeated three times. Each dot represents one zebrafish and at least 20 zebrafish were used per group. Statistical comparisons were performed using an unpaired t test and data are presented as mean ± SD. (C) The distance of eyes of embryos in control and fam91a1 MO zebrafish at 48 hpf. Experiments were repeated three times. Each dot represents one fish, and at least 20 fish were used per group. Statistical comparisons were performed using an unpaired t test and data are presented as mean ± SD. (D) The size of the fourth ventricle of control and fam91a1 MO zebrafish at 48 hpf. Each dot represents one fish, and at least 20 zebrafish were used per group. The data are presented as mean ± SD. P values were calculated using unpaired t test. Experiments were repeated three times. (E) HuC (green) expression in Tg [HuC: GFP] transgenic zebrafish. Arrows indicate midbrain. Top, lateral views; bottom, dorsal views (Scale bar, 100 μm). (F) The midbrain area fluorescence intensity of embryos in control and fam91a1. The fluorescence intensity in the midbrain area of the fam91a1 MO group is approximately half that of the control group. Each dot represents one fish, and at least 20 zebrafish were used per group. The data are presented as mean ± SD. P values were calculated using unpaired t test. Experiments were repeated three times. (G) Morphology of CaP axons from embryos at 48 hpf that were injected control or fam91a1 MO. All injections are performed at one cell stage of the Tg [Hb9: GFP]ml2 transgenic zebrafish embryos. Lateral views and enlarged views are shown (Scale bar, 20 μm). (H) Statistical results of the length of CaP axons in embryos treated as in G. For each group, more than 20 axons from 6 Tg [Hb9: GFP]ml2 transgenic zebrafish embryos are scored. The data are presented as mean ± SD. P values were calculated using unpaired t test. Experiments were repeated three times. |

Crystal structure of FAM91A1 in complex with TBC1D23. (A) Crystal structure of FAM91A1N in complex with the TBC1D23 fragment, shown in two orientations rotated 120° with respect to each other. Cyan: FAM91A1N; purple: TBC1D23 peptide. The four vertices of the triangular pyramid-like structure formed by FAM9A11-328 are indicated by ①, ②, ③, and ④, respectively. (B) Electrostatic potential surface of the complex of FAM91A1 with TBC1D23 peptide (ribbon diagram). Blue: positive potential; red: negative potential. The complex is shown in the same orientation as that of the above molecule in A. |
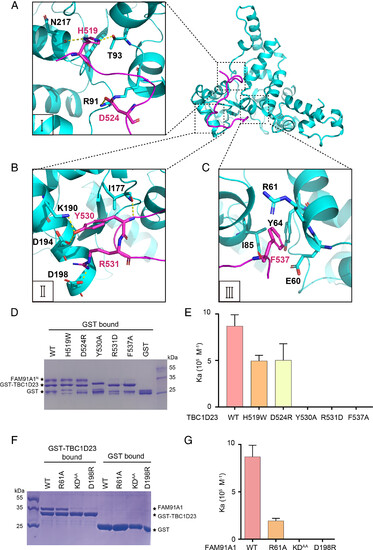
Molecular basis of TBC1D23 recognition by FAM91A1. (A) Detailed interaction between FAM91A1 (cyan) and the first segment of TBC1D23 (purple). Yellow dotted line: hydrogen bonds. (B) Detailed interaction between FAM91A1 (cyan) and the second segment of TBC1D23 (purple). Yellow dotted line: hydrogen bonds. (C) Detailed interaction between FAM91A1 (cyan) and the third segment of TBC1D23 (purple). (D) GST pull-down assays were performed with GST–TBC1D23514-558, or GST, and purified FAM91A1N wild-type (WT) or the indicated mutants. Shown is the Coomassie blue-stained SDS-PAGE gel of bound samples. (E) The affinity between FAM91A1N and TBC1D23514-538 WT or mutants in a buffer containing 100 mM HEPES, pH 7.5, 200 mM NaCl, determined by ITC. Association constants (Ka) were shown as mean ± SD. (F) GST pull-down assays were performed with GST–TBC1D23514-558 WT and purified FAM91A1N WT or the indicated mutants. Shown is the Coomassie blue-stained SDS-PAGE gel of bound samples. (G) The affinity between TBC1D23514-538 WT and FAM91A1N WT or mutants in a buffer containing 100 mM HEPES, pH 7.5, 200 mM NaCl, determined by ITC. The association constants (Ka) are presented as mean ± SD. |
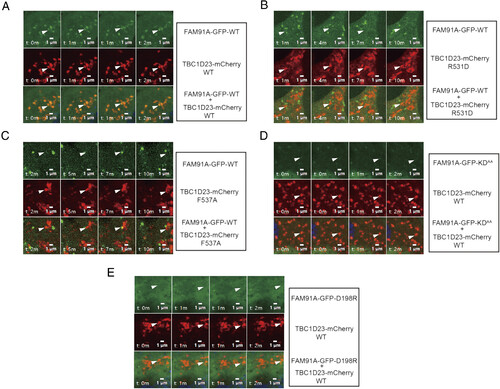
Time-lapse chasing of FAM91A1-GFP and TBC1D23-mCherry colocalization events. (A) Time-lapse chasing of FAM91A1-GFP with TBC1D23-mCherry WT, R531D, and F537A in COS7 cells. For each group, the Top shows FAM91A1-GFP images, the Middle shows TBC1D23-mCherry images, and the Bottom shows the merged images of FAM91A1-GFP and TBC1D23-mCherry. The experiment was repeated independently three times (Bars, 1 µm). (B) Time-lapse chasing of FAM91A1-GFP with TBC1D23-mCherry R531D in COS7 cells. For each group, the Top shows FAM91A1-GFP images, the Middle shows TBC1D23-mCherry images, and the Bottom shows the merged images of FAM91A1-GFP and TBC1D23-mCherry. The experiment was repeated independently three times (Bars, 1 µm). (C) Time-lapse chasing of FAM91A1-GFP with TBC1D23-mCherry F537A in COS7 cells. For each group, the Top shows FAM91A1-GFP images, the Middle shows TBC1D23-mCherry images, and the Bottom shows the merged images of FAM91A1-GFP and TBC1D23-mCherry. The experiment was repeated independently three times (Bars, 1 µm). (D) Time-lapse chasing of TBC1D23-mCherry with FAM91A1-GFP KDAA, in COS7 cells. For each group, the Top shows FAM91A1-GFP images, the Middle shows TBC1D23-mCherry images, and the Bottom shows the merged images of FAM91A1-GFP and TBC1D23-mCherry. The experiment was repeated independently three times (Bars, 1 µm). (E) Time-lapse chasing of TBC1D23-mCherry with FAM91A1-GFP D198R, in COS7 cells. For each group, the Top shows FAM91A1-GFP images, the Middle shows TBC1D23-mCherry images, and the Bottom shows the merged images of FAM91A1-GFP and TBC1D23-mCherry. The experiment was repeated independently three times (Bars, 1 µm). |
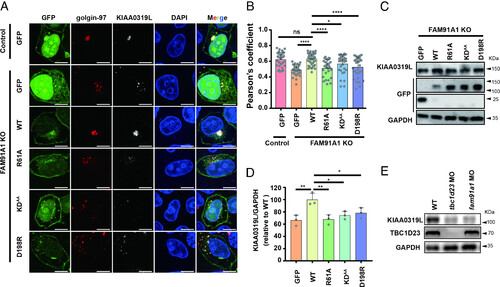
FAM91A1 residues interacting with TBC1D23 are required for endosome-to-Golgi trafficking of KIAA0319L. (A) Subcellular location of KIAA0319L in HeLa cells. The FAM91A1 KO cells were transfected with GFP, GFP-tagged FAM91A1 WT, R61A, KDAA, or D198R respectively. Cells were then incubated with antibodies against KIAA0319L (gray) and golgin-97 (red) (Scale bar, 10 μm). (B) Colocalization analysis between KIAA0319L and golgin-97 in A. Each dot represents Pearson’s correlation coefficients from one cell. Data are presented as mean ± SD, and P values were calculated using one-way ANOVA and Tukey’s multiple comparisons tests. Ns: not significant, *P < 0.05, 0.001 < ****P < 0.0001; the figure is representative of n = 3 independent experiments with similar results. (C) Immunoblot of whole-cell extracts showing that knockout of FAM91A1 decreased the total protein level of KIAA0319L in HEK293T cells. Transient expression of WT, but not these mutants or GFP vector, rescued the reduction. (D) The relative abundance of KIAA0319L compared to GAPDH was quantified in (E) and compared to the WT group. Data are presented as mean ± SD, and P values were calculated using one-way ANOVA and Tukey’s multiple comparisons tests. Ns: not significant, *P < 0.05, 0.05 < **P < 0.001; (E) Immunoblot of entire zebrafish tissue extracts showing that injection of tbc1d23 MO or fam91a1 MO decreased the protein level of KIAA0319L. |
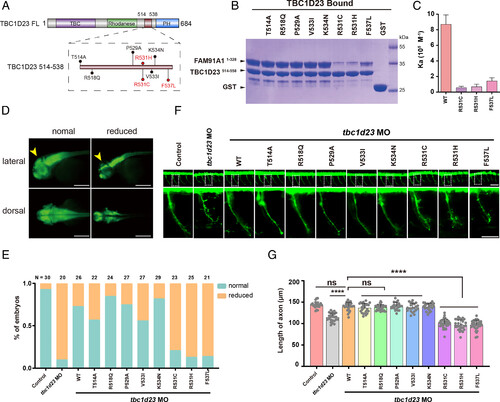
The binding of FAM91A1 with TBC1D23 predicts the risk of PCH caused by TBC1D23 mutations. (A) Schematic representation of human TBC1D23 mutations within the FAM91A1 binding region, reported in the gnomAD and TCGA databases. (B) GST pull-down assays performed with GST-TBC1D23514–558 WT, mutants or GST, and purified FAM91A1N WT. Shown is the Coomassie blue-stained SDS-PAGE gel of bound samples. (C) ITC assays determining the affinity between TBC1D23514–538 WT or mutants and FAM91A1N. Association constants (Ka) are shown as mean ± SD. (D) HuC (green) expression in Tg [HuC: GFP] transgenic zebrafish. Classification of zebrafish embryos based on the expression level of HuC (elavl3) at 48 hpf. Reduced: decreased midbrain size. Top: lateral views; bottom: dorsal views (Scale bar, 100 μm). (E) Percentage of embryos in each group as defined in D. N presents the number of embryos used for statistical analysis. All experiments were performed in three times. (F) Morphology of CaP axons in Tg[Hb9:GFP]ml2 transgenic zebrafish at 48 hpf. Bottom: the enlarged views are shown at the Top. Control: control MO injection; tbc1d23 MO: tbc1d23 MO injection; tbc1d23 MO + WT: tbc1d23 MO and human TBC1D23 WT mRNA coinjection; tbc1d23 MO + T514A: tbc1d23 MO and TBC1D23 T514A mRNA coinjection; tbc1d23 MO + R518Q: tbc1d23 MO and TBC1D23 R518Q mRNA coinjection; tbc1d23 MO + P529A: tbc1d23 MO and TBC1D23 P529A mRNA coinjection; tbc1d23 MO + V533I: tbc1d23 MO and TBC1D23 V533I mRNA coinjection; tbc1d23 MO + K534N: tbc1d23 MO and TBC1D23 K534N mRNA coinjection; tbc1d23 MO + R531C: tbc1d23 MO and TBC1D23 R531C mRNA coinjection; tbc1d23 MO + R531H: tbc1d23 MO and TBC1D23 R531H mRNA coinjection; tbc1d23 MO + F537L: tbc1d23 MO and TBC1D23 F537L mRNA coinjection. All injections were performed at the one-cell stage of the Tg [Hb9: GFP]ml2 transgenic zebrafish embryos (Scale bar, 20 μm). (G) Statistical results of the length of CaP axons in embryos were treated as in F. For each group, ~20 to 30 axons from 6 to 12 Tg [Hb9: GFP]ml2 transgenic zebrafish embryos are scored. Experiments were repeated three times. ****P < 0.001, ns: not significant. P-values were calculated using one-way ANOVA, and Tukey’s multiple comparisons test. All experiments were performed in three times. |