
Fig. 4
- ID
- ZDB-FIG-240201-65
- Publication
- Zhao et al., 2023 - FAM91A1-TBC1D23 complex structure reveals human genetic variations susceptible for PCH
- Other Figures
- All Figure Page
- Back to All Figure Page
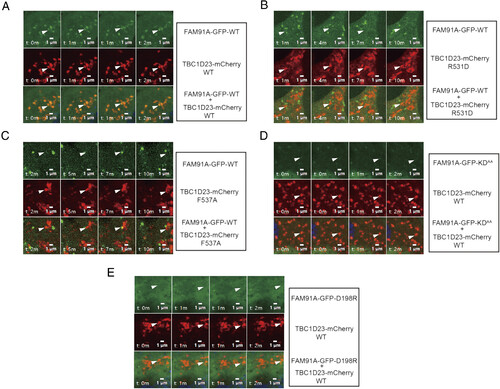
Time-lapse chasing of FAM91A1-GFP and TBC1D23-mCherry colocalization events. (A) Time-lapse chasing of FAM91A1-GFP with TBC1D23-mCherry WT, R531D, and F537A in COS7 cells. For each group, the Top shows FAM91A1-GFP images, the Middle shows TBC1D23-mCherry images, and the Bottom shows the merged images of FAM91A1-GFP and TBC1D23-mCherry. The experiment was repeated independently three times (Bars, 1 µm). (B) Time-lapse chasing of FAM91A1-GFP with TBC1D23-mCherry R531D in COS7 cells. For each group, the Top shows FAM91A1-GFP images, the Middle shows TBC1D23-mCherry images, and the Bottom shows the merged images of FAM91A1-GFP and TBC1D23-mCherry. The experiment was repeated independently three times (Bars, 1 µm). (C) Time-lapse chasing of FAM91A1-GFP with TBC1D23-mCherry F537A in COS7 cells. For each group, the Top shows FAM91A1-GFP images, the Middle shows TBC1D23-mCherry images, and the Bottom shows the merged images of FAM91A1-GFP and TBC1D23-mCherry. The experiment was repeated independently three times (Bars, 1 µm). (D) Time-lapse chasing of TBC1D23-mCherry with FAM91A1-GFP KDAA, in COS7 cells. For each group, the Top shows FAM91A1-GFP images, the Middle shows TBC1D23-mCherry images, and the Bottom shows the merged images of FAM91A1-GFP and TBC1D23-mCherry. The experiment was repeated independently three times (Bars, 1 µm). (E) Time-lapse chasing of TBC1D23-mCherry with FAM91A1-GFP D198R, in COS7 cells. For each group, the Top shows FAM91A1-GFP images, the Middle shows TBC1D23-mCherry images, and the Bottom shows the merged images of FAM91A1-GFP and TBC1D23-mCherry. The experiment was repeated independently three times (Bars, 1 µm). |