
|
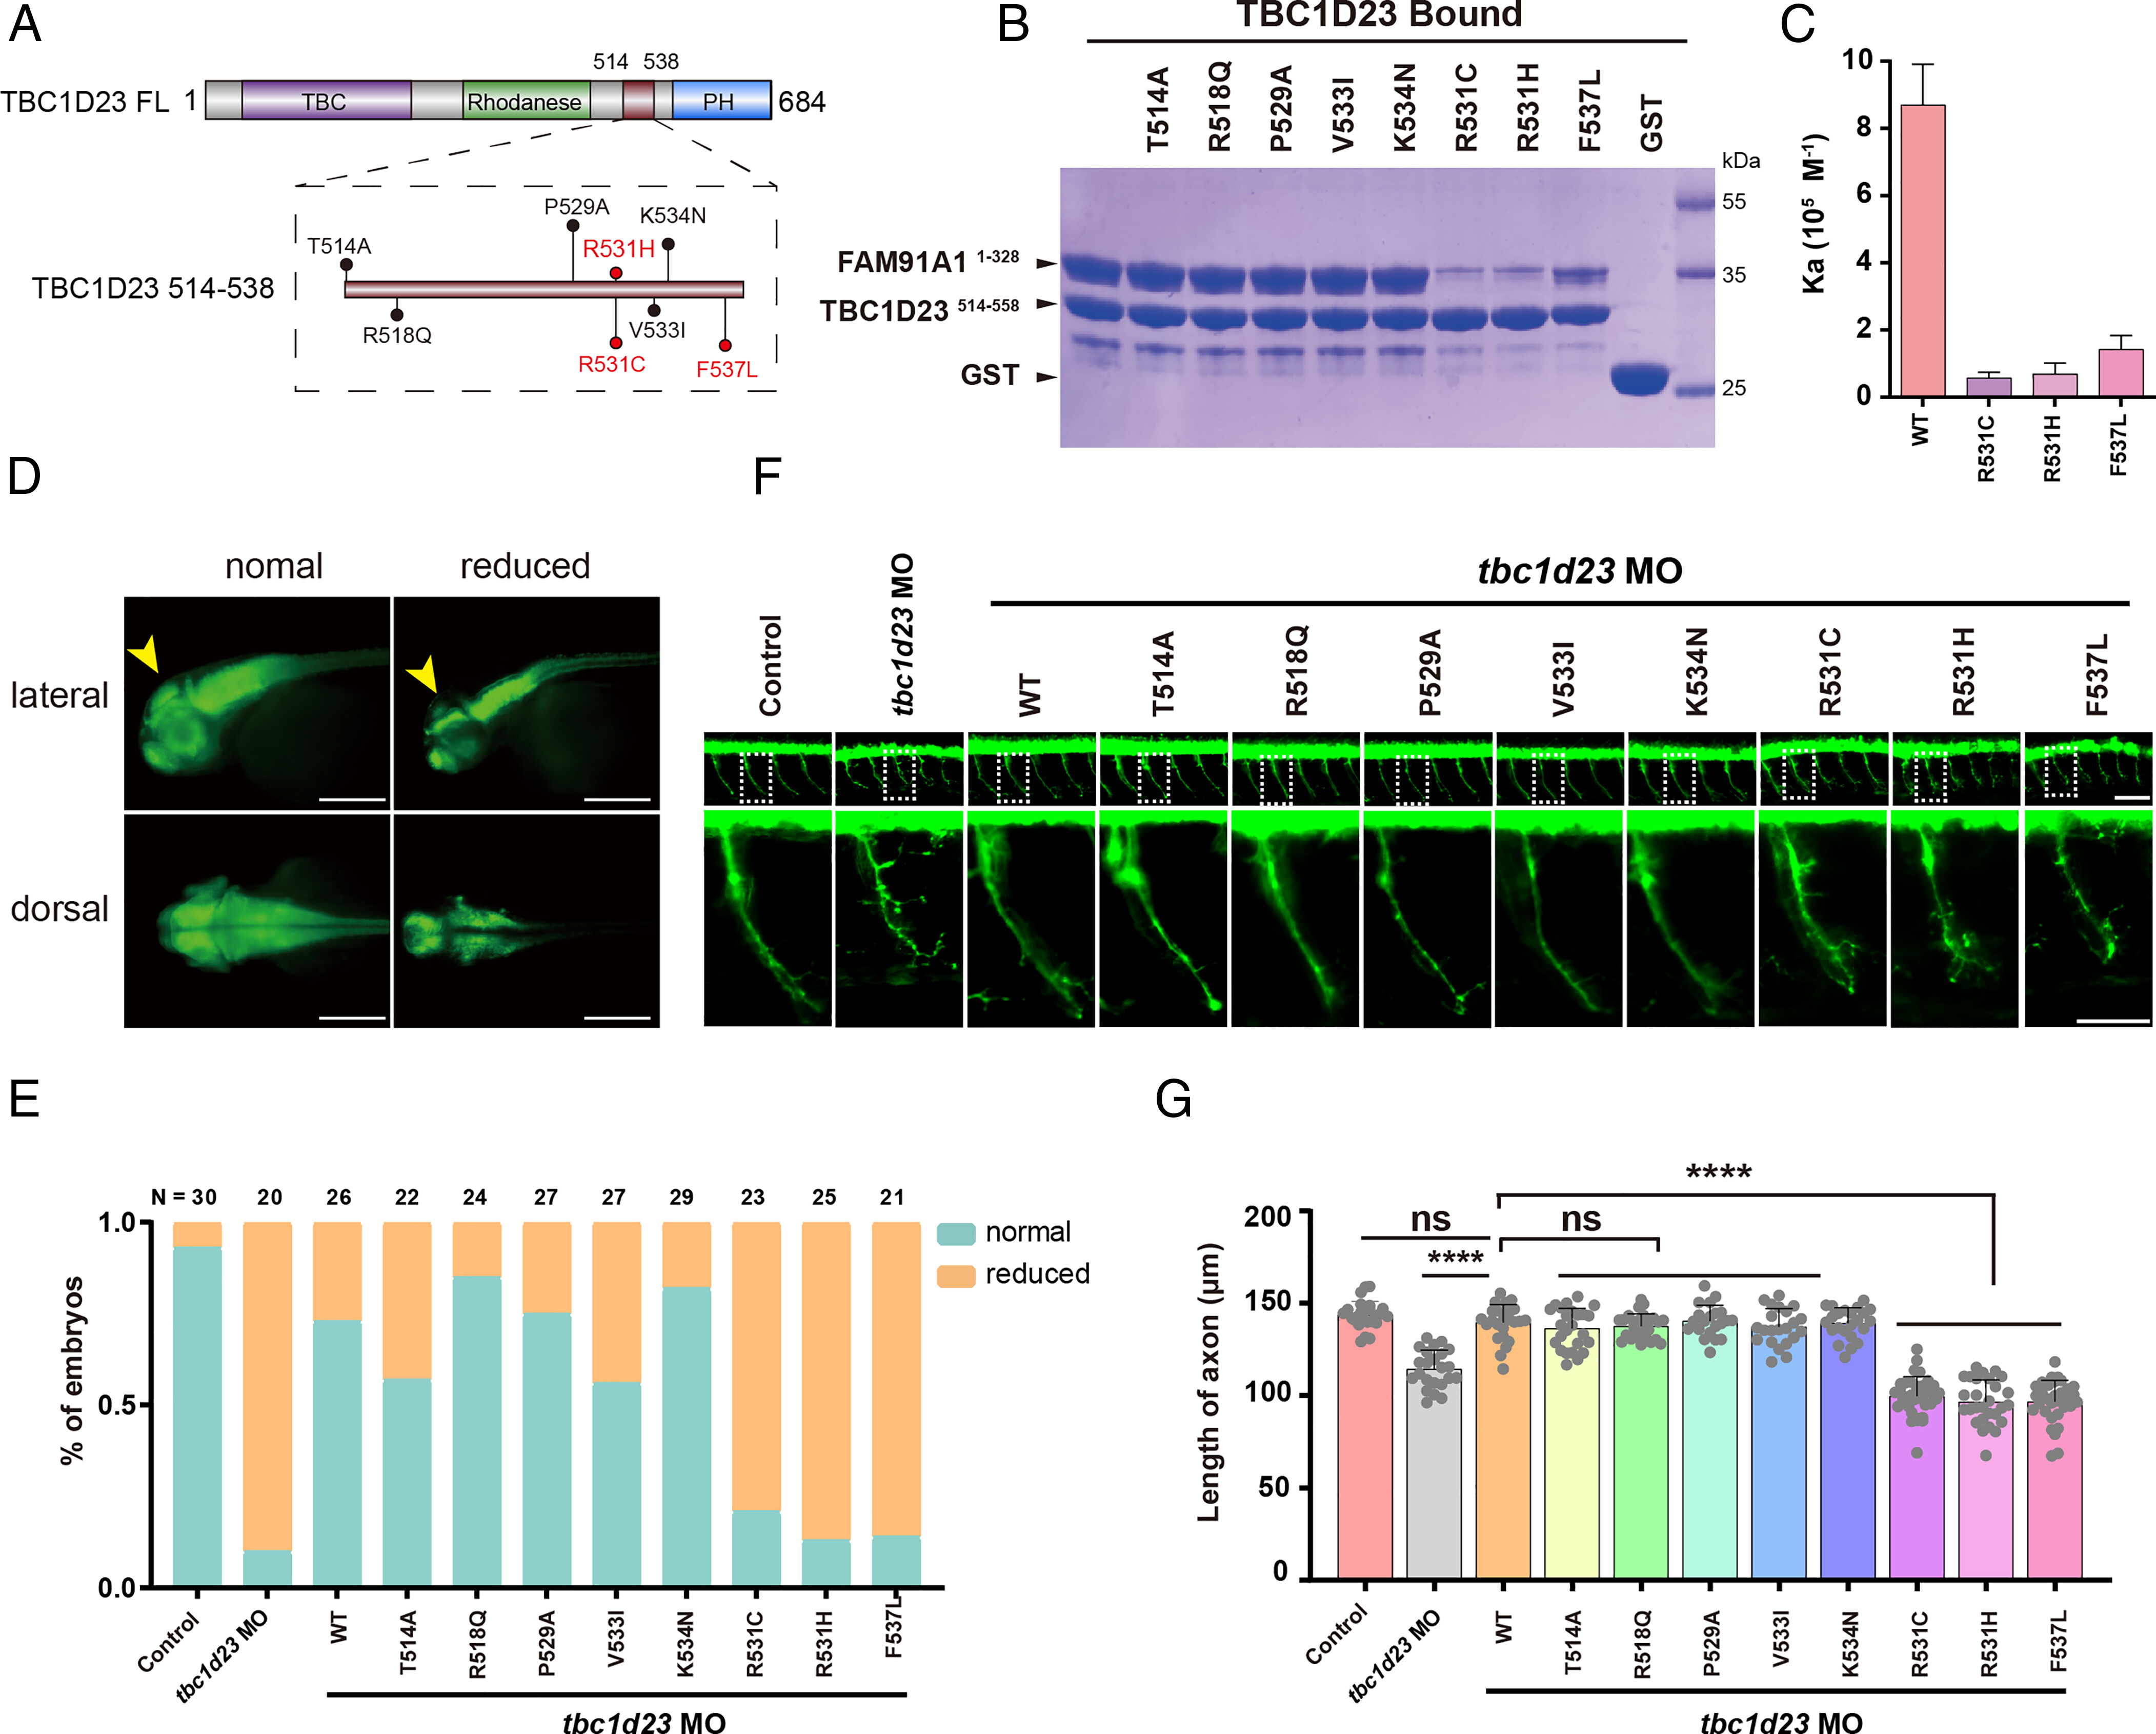
Fig. 6 The binding of FAM91A1 with TBC1D23 predicts the risk of PCH caused by TBC1D23 mutations. (A) Schematic representation of human TBC1D23 mutations within the FAM91A1 binding region, reported in the gnomAD and TCGA databases. (B) GST pull-down assays performed with GST-TBC1D23514–558 WT, mutants or GST, and purified FAM91A1N WT. Shown is the Coomassie blue-stained SDS-PAGE gel of bound samples. (C) ITC assays determining the affinity between TBC1D23514–538 WT or mutants and FAM91A1N. Association constants (Ka) are shown as mean ± SD. (D) HuC (green) expression in Tg [HuC: GFP] transgenic zebrafish. Classification of zebrafish embryos based on the expression level of HuC (elavl3) at 48 hpf. Reduced: decreased midbrain size. Top: lateral views; bottom: dorsal views (Scale bar, 100 μm). (E) Percentage of embryos in each group as defined in D. N presents the number of embryos used for statistical analysis. All experiments were performed in three times. (F) Morphology of CaP axons in Tg[Hb9:GFP]ml2 transgenic zebrafish at 48 hpf. Bottom: the enlarged views are shown at the Top. Control: control MO injection; tbc1d23 MO: tbc1d23 MO injection; tbc1d23 MO + WT: tbc1d23 MO and human TBC1D23 WT mRNA coinjection; tbc1d23 MO + T514A: tbc1d23 MO and TBC1D23 T514A mRNA coinjection; tbc1d23 MO + R518Q: tbc1d23 MO and TBC1D23 R518Q mRNA coinjection; tbc1d23 MO + P529A: tbc1d23 MO and TBC1D23 P529A mRNA coinjection; tbc1d23 MO + V533I: tbc1d23 MO and TBC1D23 V533I mRNA coinjection; tbc1d23 MO + K534N: tbc1d23 MO and TBC1D23 K534N mRNA coinjection; tbc1d23 MO + R531C: tbc1d23 MO and TBC1D23 R531C mRNA coinjection; tbc1d23 MO + R531H: tbc1d23 MO and TBC1D23 R531H mRNA coinjection; tbc1d23 MO + F537L: tbc1d23 MO and TBC1D23 F537L mRNA coinjection. All injections were performed at the one-cell stage of the Tg [Hb9: GFP]ml2 transgenic zebrafish embryos (Scale bar, 20 μm). (G) Statistical results of the length of CaP axons in embryos were treated as in F. For each group, ~20 to 30 axons from 6 to 12 Tg [Hb9: GFP]ml2 transgenic zebrafish embryos are scored. Experiments were repeated three times. ****P < 0.001, ns: not significant. P-values were calculated using one-way ANOVA, and Tukey’s multiple comparisons test. All experiments were performed in three times.