
Fig. 3
- ID
- ZDB-FIG-240201-64
- Publication
- Zhao et al., 2023 - FAM91A1-TBC1D23 complex structure reveals human genetic variations susceptible for PCH
- Other Figures
- All Figure Page
- Back to All Figure Page
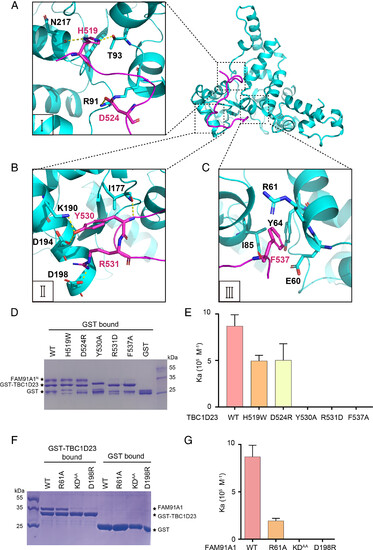
Molecular basis of TBC1D23 recognition by FAM91A1. (A) Detailed interaction between FAM91A1 (cyan) and the first segment of TBC1D23 (purple). Yellow dotted line: hydrogen bonds. (B) Detailed interaction between FAM91A1 (cyan) and the second segment of TBC1D23 (purple). Yellow dotted line: hydrogen bonds. (C) Detailed interaction between FAM91A1 (cyan) and the third segment of TBC1D23 (purple). (D) GST pull-down assays were performed with GST–TBC1D23514-558, or GST, and purified FAM91A1N wild-type (WT) or the indicated mutants. Shown is the Coomassie blue-stained SDS-PAGE gel of bound samples. (E) The affinity between FAM91A1N and TBC1D23514-538 WT or mutants in a buffer containing 100 mM HEPES, pH 7.5, 200 mM NaCl, determined by ITC. Association constants (Ka) were shown as mean ± SD. (F) GST pull-down assays were performed with GST–TBC1D23514-558 WT and purified FAM91A1N WT or the indicated mutants. Shown is the Coomassie blue-stained SDS-PAGE gel of bound samples. (G) The affinity between TBC1D23514-538 WT and FAM91A1N WT or mutants in a buffer containing 100 mM HEPES, pH 7.5, 200 mM NaCl, determined by ITC. The association constants (Ka) are presented as mean ± SD. |