
- Title
-
SorCS2 binds progranulin to regulate motor neuron development
- Authors
- Thomasen, P.B., Salasova, A., Kjaer-Sorensen, K., Woloszczuková, L., Lavický, J., Login, H., Tranberg-Jensen, J., Almeida, S., Beel, S., Kavková, M., Qvist, P., Kjolby, M., Ovesen, P.L., Nolte, S., Vestergaard, B., Udrea, A.C., Nejsum, L.N., Chao, M.V., Van Damme, P., Krivanek, J., Dasen, J., Oxvig, C., Nykjaer, A.
- Source
- Full text @ Cell Rep.
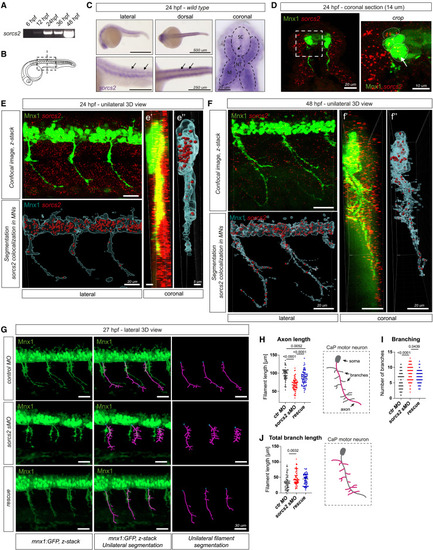
sorcs2 is expressed by spinal cord MNs, and its loss causes shorter and more branched motor axons in zebrafish embryos (A) RT-PCR shows sorcs2 expression in zebrafish embryos. (B) Zebrafish embryo at 24 hpf and analyzed areas. (C) Alkaline phosphatase WISH of sorcs2 at 24 hpf revealed sorcs2 transcripts in somites and spinal cord (SC; arrows). Coronal section exhibits enriched sorcs2 expression in the muscle (M) and notochord (NT). (D‒F) Fluorescent WISH labeled sorcs2 transcripts in Tg(mnx1:GFP)ml2 zebrafish embryos. sorcs2 was expressed by Mnx1+ MNs (arrow) at 24 hpf (D and E) and 48 hpf (F). (E and F) 3D view of z-stack confocal images of sorcs2 transcripts in mnx1:GFP embryos. Unilateral sections were reconstructed using Imaris-based surface-to-spot segmentation and filtered for transcripts co-localized with Mnx1-GFP+ MNs. (G–J) (G) Confocal z-stack images of injected mnx1:GFP embryos at 27 hpf. Motor axons were segmented as filaments (purple) and analyzed for their length (H), number of branches (I), and summarized (total) branch length (J). n = 63–70 neurons from 9–10 embryos/condition. All graphs show mean ± SEM. See also Figures S1 and S2. |

sorcs2 deficiency causes morphological defects at NMJs and lower motility in zebrafish embryos (A) Differential interference contrast images at 20.5 hpf and time-lapse of Tg(mnx1:GFP)ml2 embryos from 20.5 to 36 hpf. Truncated motor axons (arrows) of sorcs2 KD embryos pause longer at horizontal myoseptum (HMS) before continuing ventrally, but remain truncated at later stages. (B–E) (B) Confocal z-stack images of mnx1:GFP embryos at 48 hpf with reconstructed motor axons (purple). Filament quantification of axon length (C), branching (E), and total branch length (D). n = 70–84 neurons from 10–12 embryos/condition. (F) IF staining of the NMJs show z-stack projections of single axons labeled by Znp-1 (synaptotagmin-2; presynaptic compartment) and BTX-555 (AChRs; postsynaptic compartment) at 27 hpf. Black-and-white panels show segmented images with quantified NMJs. (G‒L) Quantification of HMS area revealed fragmented synapse morphology (K) while covering smaller synaptic area (L) in postsynaptic (G and H) and presynaptic (I and J) compartments. n = 90–99 axons from 10–11 embryos/condition. (M) Axonal 3D reconstruction of (F). (N) Touch-response assay of 48 hpf embryos. (O) Quantification of embryo motility. n = 10–21 embryos/genotype. All graphs show mean ± SEM. See also Figure S2; Videos S1, S2, S3, and S4. |
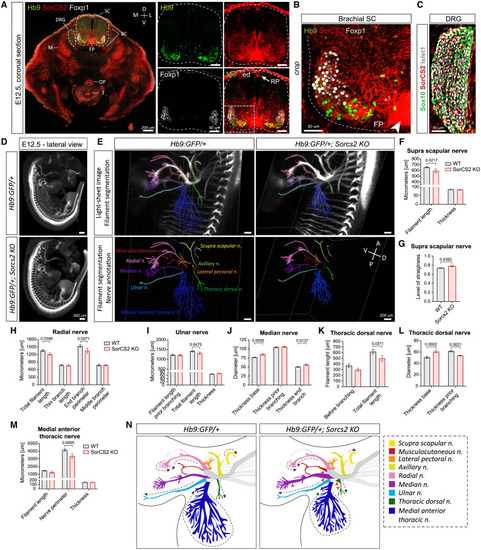
SorCS2 is expressed by murine MNs, and its loss causes shorter and thicker brachial nerves (A–C) IF staining of SorCS2 and MN markers in E12.5 mouse embryos. (A) SorCS2 is highly expressed in ventral horn, floor plate (FP; arrowhead), roof plate (RF; arrow), muscle (M), esophagus (OP), trachea (T), and boundary cap (BC) cells. D, dorsal; V, ventral; M, medial; L, lateral. (B) SorCS2 is highly expressed by all brachial MNs, in contrast to DRG precursors (Sox10+) and sensory neurons (Islet1+) (A and C). (D and E) Light-sheet images of whole-mount E12.5 embryos from Hb9:GFP lines alone (D), and combined with Imaris-based filament segmentation of nine annotated8 brachial nerves (E). D, dorsal; V, ventral; A, anterior; P, posterior. (F‒M) Quantification of the brachial nerves. (F and G) Supra-scapular nerve is shorter and straighter. (H) Radial nerve is shorter and its end branch perimeter is smaller while the side branches are unchanged. (I) Ulnar nerve is shorter while its thickness is unchanged. (J) Median nerve is thicker at its base but also before the final branching. (K) Thoracic dorsal nerve is shorter and thicker at its base (L), but narrower before the branching (L). (M) Medial anterior thoracic nerve perimeter is smaller while the thickness is unchanged. (N) A scheme summarizing observed phenotypes. Dashed arrows, affected length; arrowheads, changed thickness. n = 9 embryos/genotype. All graphs show mean ± SEM. See also Figures S3, S4, and S12; Videos S5, S6, S7, S8, and S9. |

SorCS2 loss impairs cell-fate decisions of brachial MNs in lateral motor column (A) Motor columns of brachial spinal cord, their transcription factors, and their target areas at E12.5. (B) Coronal sections of right ventral horn at E12.5 with the corresponding motor columns labeled by IF. (C‒H, J‒M) Quantification of the MN cell-fate tracing. The cell count was either summarized (C–H) or presented in the individual sections for anterior-posterior occurrence (J–M). (C) sorcs2 KO embryos exhibit higher MN count, originating from increased LMC number (D), specifically the LMCl population (F and J). LMCm (E and K) and MMC (G and L) clusters were unaltered. Pea3+ motor pool did not change (H and M). The increase in LMCl MN count was significant in the posterior sections (J), which contain MNs of radial, medial, ulnar, medial anterior thoracic, and thoracic dorsal nerves. (I) Topographical localization of brachial MNs at E12.5, color-coded according to brachial nerves they form.8. n = 7 sections/embryo, 6 embryos/genotype. All graphs show mean ± SEM. See also Figure S5. |
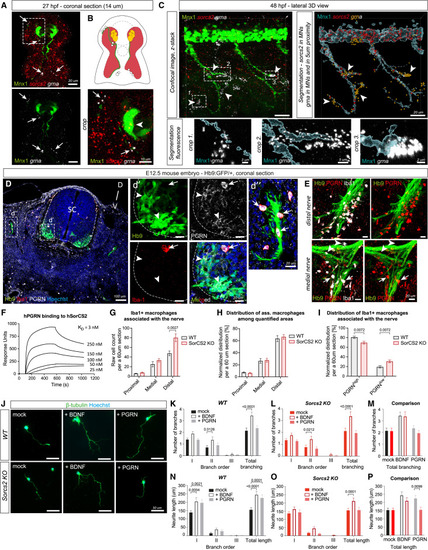
PGRN-induced motor neurite outgrowth requires SorCS2 expression in MNs (A) HCR3.0 on Tg(mnx1:GFP)ml2 embryos shows enriched grna in close proximity to motor axons (arrows) at 27 hpf, while sorcs2 is expressed by MNs (arrowhead). (B) Illustration depicting sorcs2 expression by MNs (yellow) and skeletal muscle (red), while grna (white) is enriched along motor axons (green). (C) HCR3.0 of grna and sorcs2 in Tg(mnx1:GFP)ml2 embryos at 48 hpf followed by Imaris-based segmentation. grna transcripts were filtered in cells within 5 μm proximity to Mnx1+ surface (orange; arrowheads) and inside the MNs (white). (D and E) (D) IF of PGRN and Iba-1 in coronal sections of brachial spinal cord of Hb9:GFP/+ embryos at E12.5. Hb9+ MNs express PGRN (arrowheads). PGRN is highly expressed by Iba1+ microglia (d′) and macrophages (d″) (arrows). (E) PGRN+ macrophages at branching points of medial and distal nerves. Some nerve-associated macrophages have low PGRN (arrowheads). SC, spinal cord; D, dorsal; V, ventral. (F) Surface plasmon resonance revealed concentration-dependent binding of hPGRN to immobilized hSorCS2. (G‒I) Quantification of PGRN+ macrophages associated with the Hb9+ motor axons in brachial spinal cord at E12.5. (G) Sorcs2 KO embryos exhibit more macrophages associated with the distal motor nerve. (H) Distribution of associated macrophages among quantified areas. (I) Distribution of nerve-associated macrophages in relation to their intracellular PGRN levels. n = 3 sections/embryo, 4 embryos/genotype. (J) IF of primary MN cultures grown without stimulation (mock), with 5 ng/mL BDNF, or with 100 ng/mL PGRN. (K‒P) Quantification of primary motor axon outgrowth as number of branches (K–M) and neurite length (N–P) of primary, secondary, and tertiary neurites, and when summarized. WT: mock = 37 neurons (n.), BDNF = 37 n., PGRN = 39 n. Sorcs2 KO: mock = 36 n., BDNF = 38 n., PGRN = 31 n. All graphs show mean ± SEM. See also Figure 1, Figure 2, Figure 3, Figure 4, Figure 5, Figure 6, Figure 7and Table S2. |

Adult Sorcs2 KO mice show delayed functional recovery after facial nerve crush injury (A and B) Multi-cell RNA sequencing of laser-captured MNs72 show Sorcs2 (A) and Grn (B) expression in postnatal MNs. (C and D) IF of ventral spinal cord (coronal section) confirmed SorCS2 (C) and PGRN localization (D) in postnatal Hb9+ MNs (arrowheads). Nuclei labeled with Hoechst. (E) Sorcs2 qRT-PCR in 12-week-old WT mice (n = 3). Relative expression indicates fold change normalized to cortical expression (2−ΔΔCt). (F and G) Immunoblotting of adult spinal cord shows SorCS2 in WT but not in Sorcs2 KO samples (F), which was confirmed by IF (G). β-Actin served as a loading control. (H) Localization of facial motor nucleus. (I) IF of SorCS2 and the neuronal marker SMI-32 in facial motor nucleus. (J) Scheme of the facial nerve and the injury site. (K) Regeneration of the facial nerve, scored on the basis of whisker movement. n = 9–11. (L) Area under the curve of whisker-movement recovery scores. All graphs show mean ± SEM. See also Figure S11. |
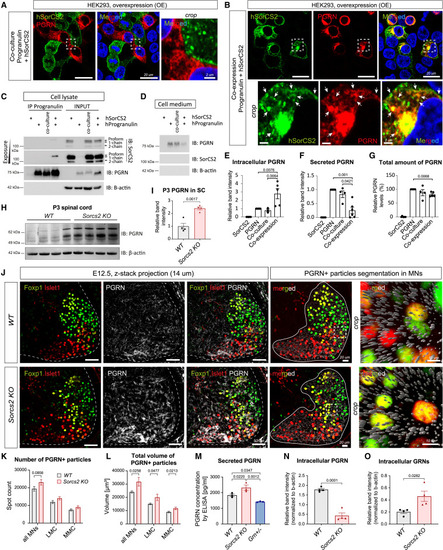
SorC2 binds PGRN to control its trafficking and secretion (A and B) IF of HEK293 cells overexpressing hPGRN and hSorCS2 as co-culture (trans configuration) (A) or co-expressing the plasmids in the same cell (cis configuration) (B). hPGRN and hSorCS2 do not co-localize in trans (A), but they do in vesicular structures and plasma membrane when in cis (arrows) (B). Hoechst-labeled nuclei (blue). (C) Co-IP of transfected HEK293 cells. SorCS2 binds PGRN in cis but not in trans. Arrows point at SorCS2 isoforms with the proform binding hPGRN. β-Actin served as a loading control for the input and negative control for the co-IP. (D) Immunoblotting of secreted hPGRN in transfected HEK293 cells. (E‒G) Compiled quantification of independent input samples from lysates and cell media blotted for hPGRN and HA-hPGRN. n = 4/5. When in cis, SorCS2 retains hPGRN intracellularly (E) while reducing PGRN secretion (F). (G) Total PGRN levels are decreased in cis but not in trans configuration. (H and I) (H) Immunoblotting of spinal cord from P3 pups (n = 4 pups/genotype). (I) The band intensity is normalized to the loading control. (J‒L) Confocal scanning and analysis of PGRN+ fluorescent signal in posterior coronal sections of brachial MNs at E12.5. n = 6 embryos/genotype. (J) IF staining of PGRN (left panels) was segmented in Imaris (right panels) as spots (gray). (K and L) LMC and MMC populations were either pooled (“all MNs”) or distinguished by Islet1 and Foxp1 IF. (K) Quantification of PGRN+ particle count. (L) Quantification of total volume of PGRN+ particles. (M) ELISA of conditioned media from primary cortical neuron cultures (DIV 7). Grn+/− served as semi-negative control. n = 3. (N and O) Immunoblot quantifications of lysates from the cortical cultures (n = 4). All graphs shown mean ± SEM. See also Figures S11 and S12; Video S10. |

|